
 Quack AI
 NEAR Protocol
 Pudgy Penguins
 Pearl
Pearl Quant
Quant Quantus
 Sui
Sui
- The ECOMI token gave a breakout of the falling parallel channel last night with a 21% increase in just one day.
- The daily price graph shows that the 20-day moving average seems to be a short-term resistance zone for the OMI token.
- The OMI/BTC pair price is trading at 0.0000001025 Satoshis, which jumped by 11.9%.
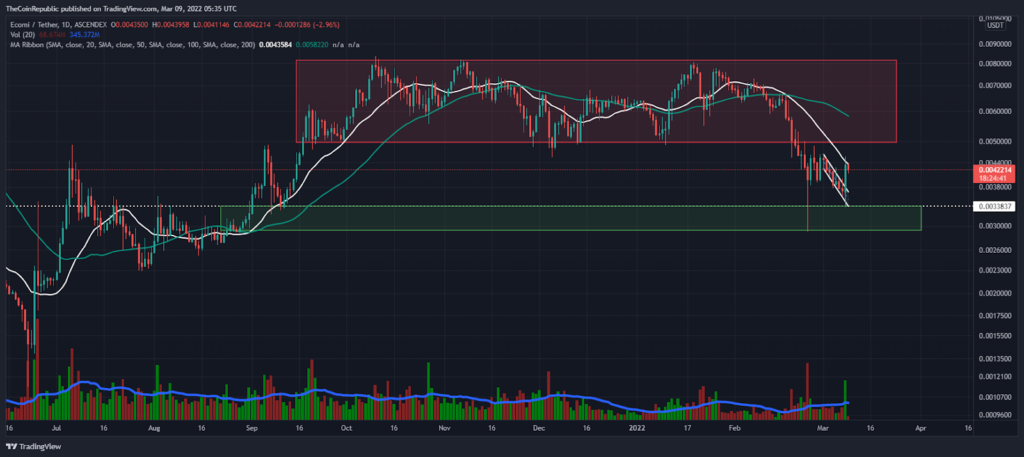
The price of the ECOMI token saw a solid rally last night where the bulls gained around 17% of their costs. The price of the token was trading in a descending parallel channel (white) for the past several days, and yesterday the buyers managed to cross the bearish path. Bulls need to keep the OMI price tight; else, the short-sellers may again try for a pullback.
The current price of the Ecomi token is above the demand zone (green), which appears to be a significant buying point. However, today the OMI token is retreating after a sharp rise and is now trading at $0.0042227, down 2.9% at the time of writing. Bulls were waiting for a bullish candle like this and they will take it as a trend reversal sign. Meanwhile, the coin is resisting the 20-day moving average line, and the volatility of RedZone (50-MA) is well above the current price.
Although daily trading volume was creating less volatility by falling below the daily average moving line (blue), traders saw a 118% increase in trading volume last night. Nevertheless, the volume to market capitalization ratio is 0.01203. The OMI/BTC pair is trading at 0.0000001025 Satoshis, jumped 11.9%, and the ETH pair price is turning favorable for the bulls at 0.0000001557 ETH.
Bullish sentiment is attempting to catch investors’ attention
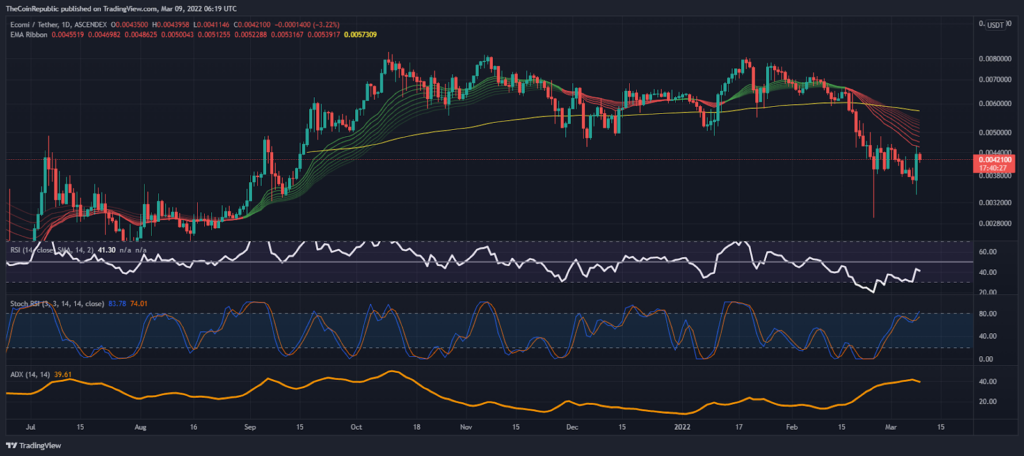
In the context of the daily price chart, the OMI price is trading below the EMA ribbon. Nevertheless, the EMA ribbon indicator indicates weakness for the ECOMI token and the 200-EMA line may act as a bullish barrier during the recovery.
The Relative Strength Index (RSI) is trading below the halfway line (50-point) on the daily price graph. But on the other hand, Stoch RSI is heading towards an overbought phase. Now K is at 84-points and D is at 74-points, indicating bullish strength.
The Average Directional Index remains at 39-point, which is witnessing a substantial upward move for the ECOMI token.
Conclusion
The ECOMI token has spent less than 6 months under a broad consolidation phase and the bulls are aiming to reach the same position again. If the bulls manage to hold the price above the EMA ribbon, OMI token may consolidate below $0.00800 again.
Support level – $0.0050 and $0.0080
Resistance level – $0.0034 and $0.0022
Disclaimer
The views and opinions stated by the author, or any people named in this article, are for informational ideas only, and they do not establish financial, investment, or other advice. Investing in or trading crypto assets comes with a risk of financial loss.




