
 Boomer
 Covenant x402
 Claudia
 Pearl
Pearl Quantus
 Bitcoin
 NEAR Protocol
- The Uniswap token price is trading into the ascending parallel channel in terms of the hourly price chart.
- The UNI token reclaimed 42% trading volume last night; is volume heading to a bullish trend?
- The daily price chart of UNI token is approaching the 100-EMA line after holding above the 20 and 50 EMAs.
Uniswap token again noted a sharp recovery since its March lows, and the price action suggests an ascending parallel channel. Prior to the recovery, UNI had been underperforming since its all-time high of $44.97, so the cryptocurrency has lost almost 80% of its cost at its February 24 lows. The UNI token flashed a double top pattern in early January, and the coin saw a solid bearish momentum.
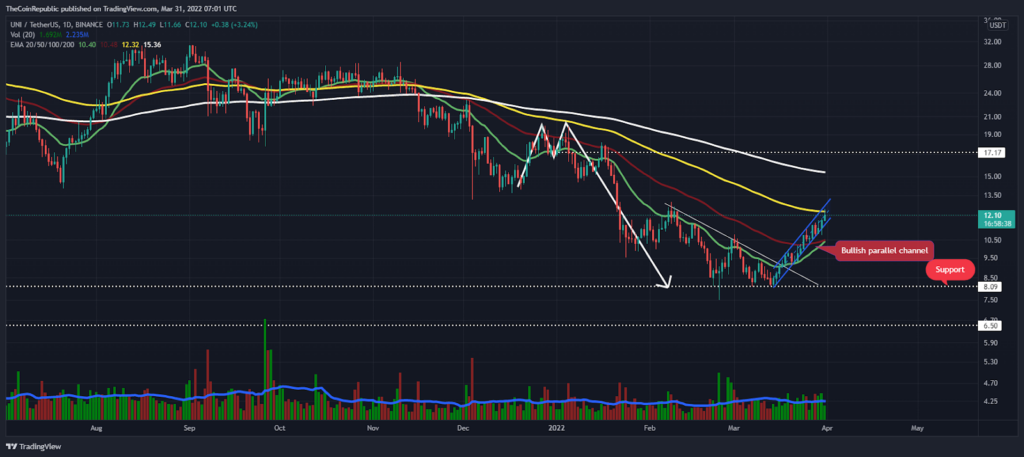
The bottom line of the parallel channel has long been an important dominance zone for buyers; instead of a support line the bulls were unable to cross the parallel range. With trading in the channel, buyers are approaching the 100-day moving average (yellow) in terms of the daily price chart. Similarly, the 50-EMA was a red zone of volatility which is now acting as a support zone.
The live price of the Uniswap token is trading at $12.0, which is up 7.7% at the time of writing. However, the asset recovered nearly 50% of its cost since its March lows. Also, UNI/BTC pair price is trading at 0.0002564, by an 8.4% incline.
Have you noticed hidden chart patterns?
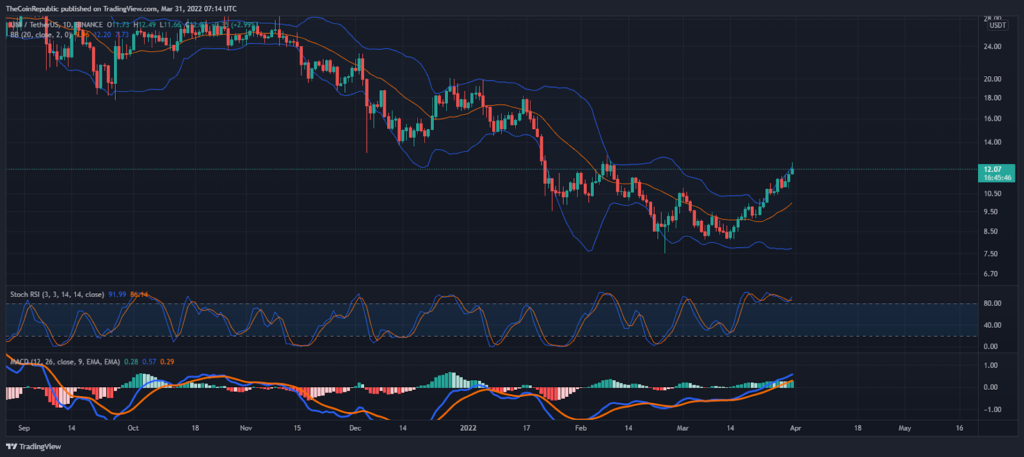
The daily price chart of UNI token is trading near the higher range of the Bollinger Bands indicator, the half-line (20-MA) may act as a recovery zone if any case asset starts retracement phase.
Stoch RSI noted the double top pattern in the daily price chart into the overbought territory. Moreover, the MACD indicator has continued moving higher and interrupted the neutral level after the bullish crossover.
Conclusion
There is no doubt that the uniswap token trend has been caught by the bulls and they continue to push the asset price higher with higher liquidation trading sessions. The 100-EMA could act as a short-term bullish barrier.
Support level – $8.0 and $6.5
Resistance level – $14 and $20
Disclaimer
The views and opinions stated by the author, or any people named in this article, are for informational ideas only, and they do not establish the financial, investment, or other advice. Investing in or trading crypto assets comes with a risk of financial loss.




