
 Boomer
 Pearl
Pearl Covenant x402
 Claudia
 Bitcoin
 hi
hi NEAR Protocol
- Tron price is rising inside an ascending triangle pattern over the daily chart.
- The crypto asset has successfully recovered above 20, 50, 100, and 200-days Daily Moving Average.
- The pair of TRX/BTC is at 0.000002693 BTC with an intraday gain of 5.13%.
Tron price is rising inside an ascending triangle pattern over the daily chart. The token is trying to gain strong uptrend momentum over the chart. In the long-term view, TRX coin is trying to make a rounding bottom pattern recovery curve. TRX coin is trading with strong uptrend momentum and is trying to recover through a rounding bottom pattern. TRX bulls look determined to register the token’s maximum recovery, which makes higher highs. TRX coin is planning to break out of the ascending triangle pattern with steady uptrend momentum.
Tron price is presently CMP at $0.086 and has gained 5.03% of its market capitalization in the last 24-hour period. Trading volume has increased by 8.28% in the intraday trading session. Volume change has increased by a very low margin, which signifies that TRX must accumulate more buyers to maintain the uptrend momentum. And also to successfully sustain above the triangle pattern. Volume to market cap ratio is 0.1285.
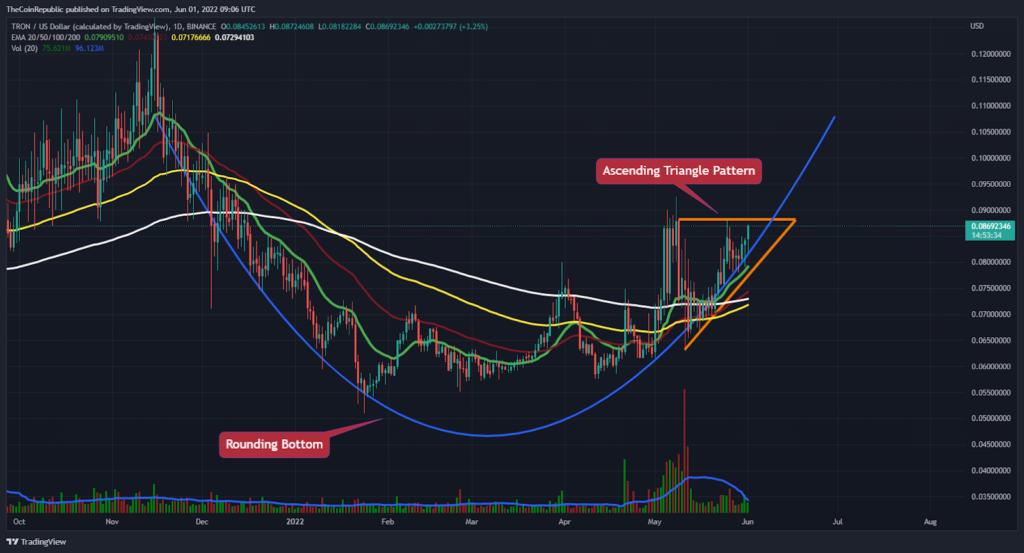
Tron coin price is rising with strong uptrend momentum over the daily chart. TRX must maintain this strong momentum to register its breakout from the ascending triangle pattern. However, volume change can be seen below average and needs to grow for TRX to gain the uptrend momentum. TRX bulls must be determined to register the token’s breakout. Meanwhile, bears may interrupt the token’s uptrend momentum as soon as it reaches the upper trendline of the ascending triangle pattern.
Support on the lower end is at $0.080, and resistance on the higher side is at $0.92.
Technical Indicators are Providing Bullish Signals for TRX
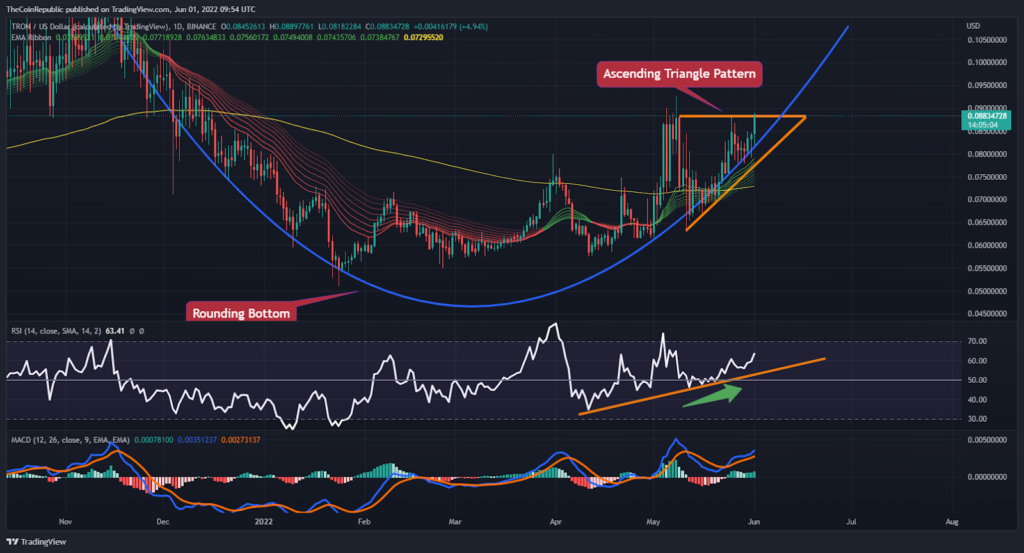
Tron price is trading with strong uptrend momentum over the daily chart. Technical indicators suggest the bullish rally of Tron inside the ascending triangle pattern. EMA ribbon shows the bullish rally of TRX coin. As TRX price is above the EMA lines and hence it shows the bullish momentum of the token. Relative Strength index showcases strong bullish momentum of TRX coin. TRX is approaching the overbought territory above an upward trendline.
MACD exhibits uptrend momentum of TRX coin. The MACD line is ahead of the signal line after a positive crossover.
Conclusion
Tron price is rising inside an ascending triangle pattern over the daily chart. The token is trying to gain strong uptrend momentum over the chart. In the long term view, TRX coin is trying to make a rounding bottom pattern recovery curve. Technical indicators suggest the bullish rally of Tron inside the ascending triangle pattern. EMA ribbon shows the bullish rally of TRX coin. As TRX price is above the EMA lines and hence it shows the bullish momentum of the token. TRX investors need to wait until bulls sustain above the trendline.
Technical Levels
Support Levels: $0.080
Resistance Levels: $0.92
Disclaimer
The views and opinions stated by the author, or any people named in this article, are for informational ideas only, and they do not establish the financial, investment, or other advice. Investing in or trading crypto assets comes with a risk of financial loss.




