Universal High Income
 Aerodrome Finance
 Lighter
 Axis Robotics
 Pearl
 Pudgy Penguins
 NEAR Protocol

- Hedera coin is training in a symmetrical triangle pattern after reversing from monthly low.
- The market cap remains below $2 billion, despite an increase of over 6% over the past 24 hours.
- The HBAR coin belonging to the bitcoin pair is trading up 6.23% at 0.00000318 Satoshis.
Since last September, the hedera currency has underperformed as each rally turned into a sell-off.
The HBAR monthly chart above indicates a fall in demand for HBAR tokens beginning with the collapse of the 0.3036 support level in December ’21. Another breach of the bullish inside-bar support (0.1937), which the sellers also shattered
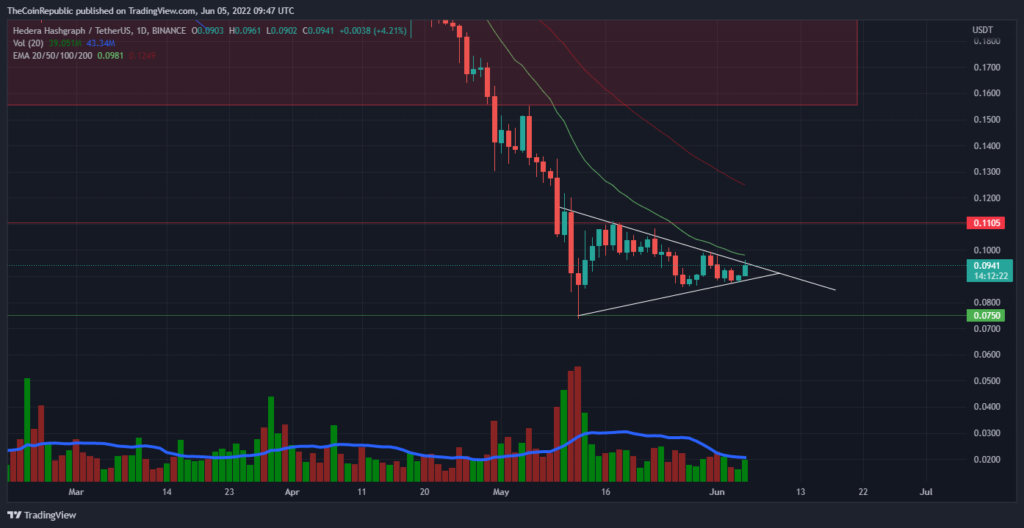
Recently the HBAR token recorded a new 52-week low at the $0.0736 mark. As Hedera coin is training in a symmetrical triangle pattern (white) after reversal from the monthly low. And the bulls are approaching the upper trend line of the pattern to reduce selling pressure in the near term.
Thus at the time of writing HBAR was trading at the $0.094 mark, while having reached the conceptual round level of $0.10 as resistance. With a slight recovery of 3.8% in the weekly price candle, the bulls are going to look for the first bullish weekly close after a long time.
Meanwhile, the market cap remains below $2 billion, despite an increase of over 6% over the past 24 hours. Moreover, the HBAR coin belonging to the bitcoin pair is trading up 6.23% at 0.00000318 satoshis. Traders with higher outlook saw over 100 jumpin trading volume over the past night.
Triangle pattern still exists
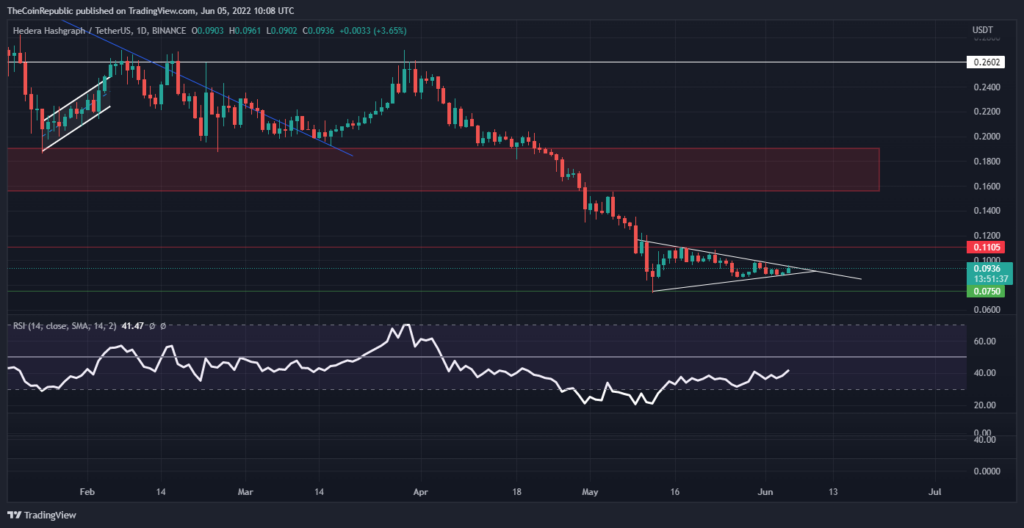
Furthermore, important EMAs such as 20 and 50 are well above Hedera coin’s current price in terms of the daily price chart. And the 20 EMA can act as the most recent bullish barrier.
Along with the bullish movement of HBAR, the RSI indicator moved towards the semi-line on the daily chart.
conclusion
As the bulls are approaching the upper trendline of the lower pattern to reduce selling pressure on Hedera coin for the short term. Moreover, the bulls are going to note the first bullish weekly close after a long time.
Support level – $0.085 and $0.075
Resistance level – $0.11 and $0.15
Disclaimer
The views and opinions stated by the author, or any people named in this article, are for informational ideas only, and they do not establish the financial, investment, or other advice. Investing in or trading crypto assets comes with a risk of financial loss.