
 Boomer
 Pearl
Pearl Covenant x402
 Claudia
 Bitcoin
 hi
hi NEAR Protocol
- The QNT price after a downtrend is now at a strong uptrend movement over the daily price chart.
- The crypto asset is moving above the 20, 50, 100 days moving average and is trying to approach the 200 DMA.
- The QNT/BTC pair is at 0.004266 which is at a gain of 14.26% in it.
The project is built as an operating system distributed ledger technology and Overledger Network for connecting different blockchain networks. The main aim of Quant is to bridge the gap using Overledger that exists between different blockchains.
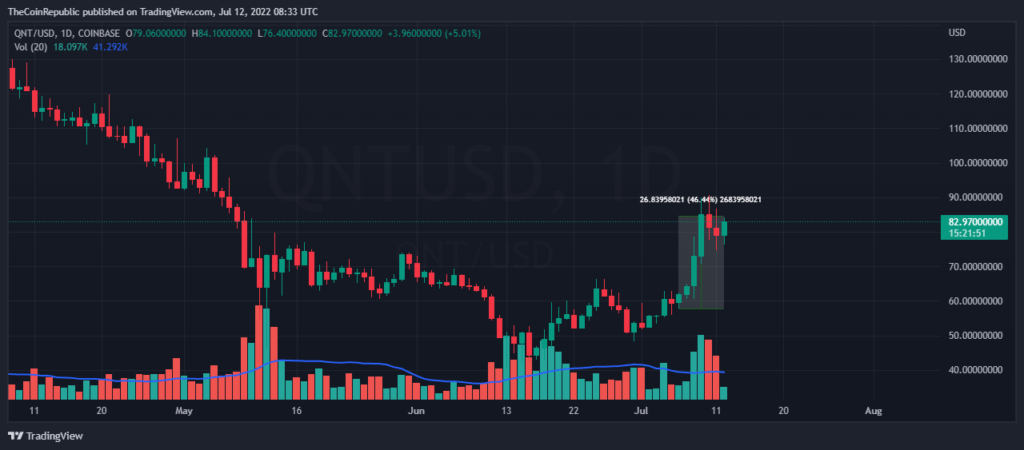
The QNT price is at an uptrend movement with a good pace over the daily price chart. The bears tried to interrupt the process but this strong accumulation of bulls didn’t let them to do so and is now again moving positively. Though the price has recovered, the recovery is not enough to fill the gaps of loss of investors, so this speedy recovery should continue. The QNT price has gained 46% in a week and the price was at a lower low of $75.51 over the intraday trading session.
The price for one QNT coin is currently trading at $81.87 which is at a gain of 7.67% in its market capitalization in the last 24 hrs. The token has trading volume of 71 million which is at a loss of 20.81% in the 24 hrs trading session and a market cap of 988 million. The volume market cap ratio is 0.07286.
What do Technical Indicators Suggest for QNT
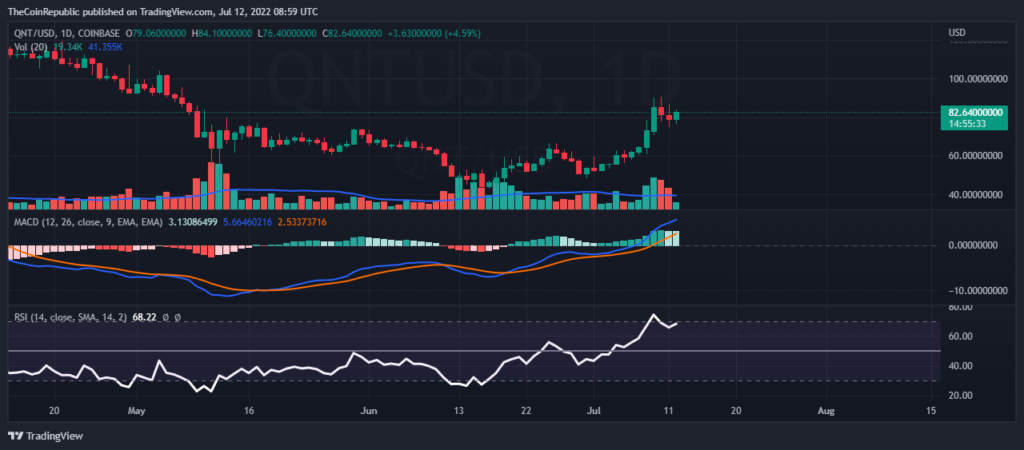
The trading volume is still moving below the average but still it is improving and the price is moving upwards after making a cross at the upper band of the bollinger band cloud.
While talking about the MACD indicator we can observe the buyers line is above the sellers signal line which indicates the buyers are dominant here and support the uptrend movement. The relative strength index going with the same is now approaching the overbought region on the daily graph. The RSI value is above 65 and is about to be overbought.
Conclusion
The QNT price is at an uptrend movement with a good pace over the daily and hourly price chart. Though the price has recovered, the recovery is not enough to fill the gaps of loss of investors. The QNT price has gained 46% in a week. The technical indicators indicate a bullish rally ahead.
Technical levels
Resistance levels: $90 and $95.8
Support levels: $74 and $69
Disclaimer
The views and opinions stated by the author, or any people named in this article, are for informational ideas only, and they do not establish the financial, investment, or other advice. Investing in or trading crypto assets comes with a risk of financial loss.




