
 Covenant x402
 hi
hi Pearl
Pearl Pons
Pons Claudia
 Bitcoin
 Injective
- File coin price is in a strong uptrend and recently it formed a bullish flag and pole pattern on a daily time frame.
- The coin price formed a symmetrical triangle pattern over a 4-hour time frame.
- The pair of FILE/BTC I streaming at the price level of 0.00056 with an. Increase of 2.75% in the past 24 trading hours.
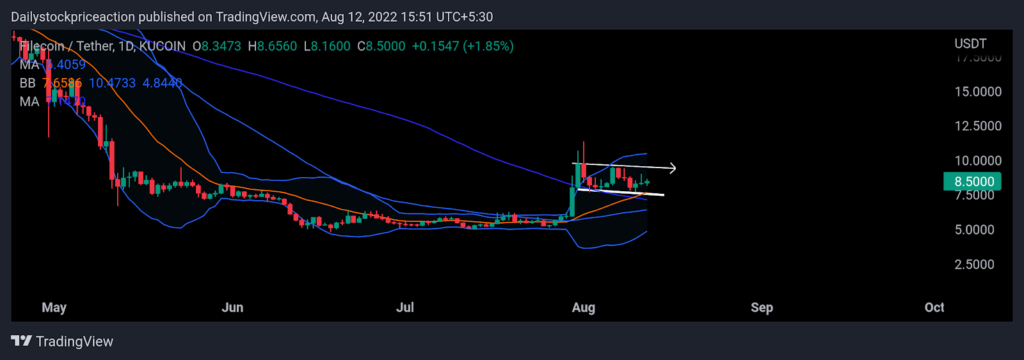
The file coin price is trading at the long-term supply zone after breaking every small-term resistance. As the price action suggests the coin price is forming a flag and pole bullish chart pattern on a daily time frame. Before the break, the coin price was in consolidation for a long time. As a result, the breakout of the supply zone was massive and triggered a strong bullish rally. After a massive bullish rally, the FILE coin price has again started consolidation. The FILE coin price is forming higher high and higher low price structures on a daily time frame. At present, the FILE coin price has broken the 50 and 100 important Moving Averages. Moving upwards the coin price can be seen resting at these Moving Averages. The coun price is currently trading in the middle of the Bollinger band indicator after failing to surpass the upper band. Volumes have increased as the coin price triggered a breakout. As of now, investors should wait for a breakout of the bullish chart pattern flag and pole and then act accordingly.
The FILE coin price is forming a symmetrical triangle pattern on a 4-hour time frame
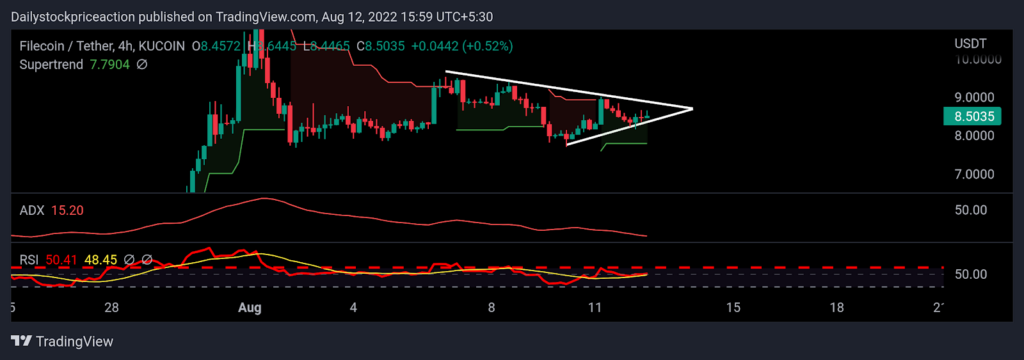
Average Directional Movement Index: ADX curve has been rising on a higher time frame as the coin continues to rise. It is a positive sign for the coin price. In a daily time frame, the ADX curve has dipped out of the 20 mark and has turned upwards. As the coin price rests at the short-term demand zone on a 4-hour time frame. Investors should wait for a positive candle formation at the demand zone.
Relative Strength Index: RSI curve is trading at the level of 50.41. The RSI curve has crossed the halfway mark of 50. The FILE coin price has given a breakout of a strong supply zone on a daily time frame. Once the coin price breaks the flag and pole pattern, the RSI curve can be seen moving up rapidly. The RSI curve has crossed the 14 EMA yellow line indicating a short-term bullishness.
Supertrend: Supertrend indicator is positive as the coin price broke the important small-term supply zone on the daily timeframe. Since then the coin price has started moving up rapidly. As of now, the coin price has broken the super trend sell line which has triggered a buy line.
CONCLUSION: The FILE coin price is trading at the demand zone after breaking the supply zone in a 4-hour time frame. At present, the coin price is bullish as the technical parameters suggest. The coin price has given a breakout of an important supply zone on a daily time frame. Therefore the investors can expect a bullish momentum in the upcoming days once the coin price breaks the flag and pole pattern.
SUPPORT: $8.00 and $7.89
RESISTANCE: 9.50 and $9.00
Disclaimer
The views and opinions stated by the author, or any people named in this article, are for informational ideas only, and they do not establish financial, investment, or other advice. Investing in or trading crypto assets comes with a risk of financial loss.




