
 Minter
 Quack AI
 Pearl
Pearl Monero
 The Sandbox
 Pons
Pons Bittensor
- The FLOW token price is trading at the demand zone, as it trades in a very small range on a daily time frame.
- The token price is forming a falling wedge pattern on a weekly time frame.
- The pair of FLOW/BTC is trading at the price level of 0.00008464vwith an increase of 0.69% in the past 24 hours.
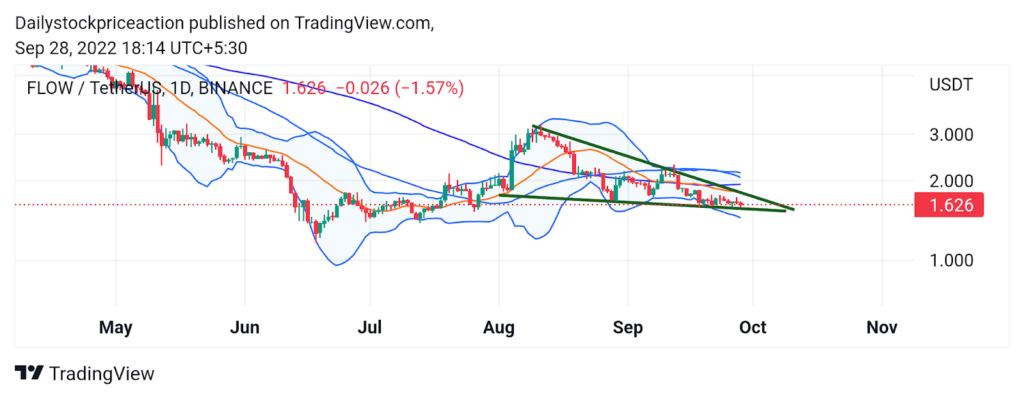
The FLOW token price as per the price action is trading at the demand zone, while it forms a reversal chart pattern. The token price has been facing continuous rejection of the downward sloping green trendline, while it bounces off the demand zone. As a result, the token price is forming lower low and lower high formation on a daily time frame. The token price is consolidating near the demand zone in a very small range and a breakout on the other side will trigger a rapid and big move. Recently, the token price faced the heat of the global market, which resulted in a strong bearish rally. Since then the token price has failed to recover from the demand zone. The recent fall in the price of FLOW token price had led to the breakdown of the 50 and 100 MAs. Currently, the token price is trading below the 50 and 100 MAs. moving upwards the token price can be seen facing strong bearish pressure from these MAs. The FLOW token price is currently taking at the lower band of the Bollinger band indicator, after failing to surpass the upper band. Volumes have increased as the token price fell. Investors should remain cautious and wait for a proper bounce backs signal.
The FLOW token price is forming a falling wedge pattern on a daily time frame
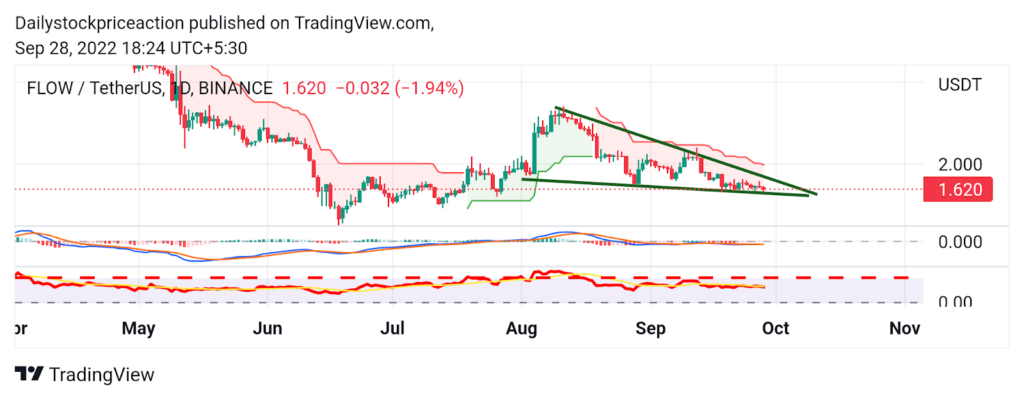
Relative Strength Index: RSI curve is trading at the price of 42.39 as the token bounces off the demand zone. At present, the RSI curve has fallen below the 20 SMA. The token is forming higher low and higher high formation on a 4-hour time frame as the token shows bearishness in the higher time frame. The FLOW token price can be seen moving if it sustains the recent gains and if it does then the RSI curve can be seen moving even higher up supporting the trend. Once the RSI curve crosses the halfway mark of 50, the FLOW token price can be seen moving up quickly.
Moving Average Convergence Divergence: MACD indicator has given a negative crossover as the token gave a breakdown of an hourly demand zone. The blue line crossed the orange line on the downside. This has resulted in the token price moving down strongly in a 4-hour time frame. The fall in the FLOW token price has been strong and therefore the MACD lines were seen widening. As of now, the token price has bounced off the demand zone, and if the same continues then the MACD line can be seen giving a positive crossover.
Supertrend: The FLOW token price has turned bearish as it failed to surpass the supply zone forming a strong bearish candlestick pattern on a daily time frame. Recent bearishness resulted in the FLOW token price falling below the important short-term demand zone. Previously the FLOW token price was resting on the super trend buy line. As the token price fell, the super trend indicator triggered a sell signal. As of now, the FLOW token price is trading below the super trend sell line, and moving upwards the token price can be seen facing rejections off the super trend line.
CONCLUSION: The FLOW token price is resting at the long-term demand zone, as it forms a bullish chart pattern on a daily time frame as the price action suggests. The technical parameters have tuned negative as the token price fell to the demand zone. As of now, the token price is consolidating. It remains to see if the token price will break the supply don’t and start moving up after consolidation or break the demand zone and fall. An investor should wait for a proper signal of breakout on either side and then act accordingly.
SUPPORT: $1.4 and $1.3
RESISTANCE: $2.2 and $3.2




