
 hi
hi Covenant x402
 Boomer
 Claudia
 Lighter
 NEAR Protocol
 Injective
- The HUOBI token price has fallen strongly from the supply zone on a daily time frame.
- The HUOBI token price has fallen below the important demand zone on a daily time frame.
- The pair of HUOBI/BTC is trading at the price level of 0.0002122 with an increase of 0.21% in the past 24 hours.
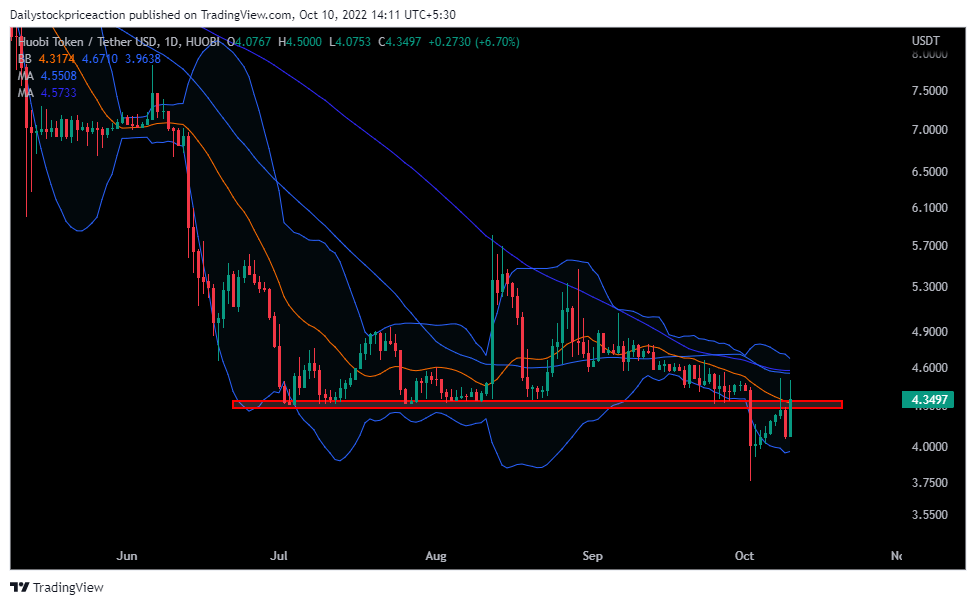
The HUOBI token price, as per the price action, is facing strong bearish pressure from the supply zone as it falls continuously from there and is taking constant support from the demand zone green trendline. The token price is hovering below the demand zone again after failing to surpass the supply zone. This comes after the token price faced a strong bearish heat that prevailed in the global cryptocurrency market. The HUOBI token price has managed to sustain above the demand zone, besides the strong bearish pressure. This indicates the presence of bulls. The HUOBI token price is forming lower low and lower high formations on a weekly time frame. As of now, the token price fell below the 50 and 100 Moving Averages. The recent fall in the price of HUOBI token price from the supply zone has resulted in the token price trading below the 50 and 10p MAs. Moving upwards the token price can be seen facing strong rejection from these MAs. At present, the token price is trading at the lower band of the Bollinger band indicator after again failing to surpass the upper band. The token price has also gone below the 20 EMA indicating a bearish trend for the upcoming trading days. Volumes have increased as the token price fell below the demand zone strongly.
The HUOBI token price is in a strong bear grip as it fails to surpass the recent broken demand zone
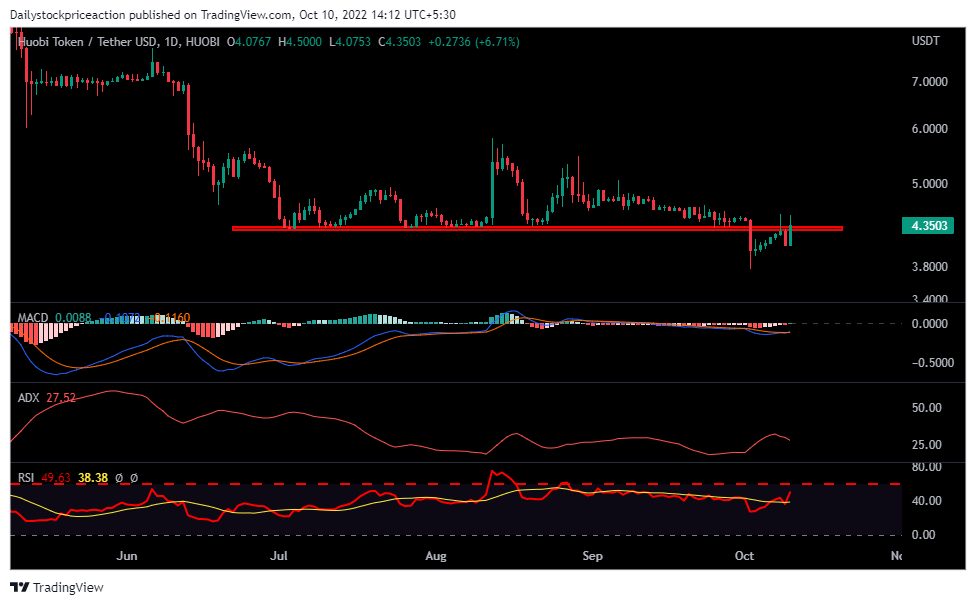
Moving Average Convergence Divergence: As the token fell to the demand zone on a daily time frame, the MACD indicator showed a negative crossover. On the downside, the blue line crossed the orange line. As a result, the token price has fallen significantly in a 4-hour time frame. The recent fall in the HUOBI token price was strong and rapid. As of now, the token price has started consolidating again at the demand zone, and the gap between the blue and orange lines can be seen widening, indicating that the trend is continuing.
Relative Strength Index: RSI curve is currently trading at the level of 40.44.The RSI curve is yet to cross the halfway mark of 50. Once the token price breaks the supply zone, the RSI curve can be seen moving upward crossing the halfway mark of 50, supporting the trend of the HUOBI token. The RSI curve has also crossed the 14 SMA downward indicating some bearishness before the further upwards movement. If the token falls below the demand zone, the RSI curve can be seen falling further.
Average Directional Movement Index:
The HUOBI token price is struggling to break out of the supply zone as it again falls to the demand zone. The same is depicted by the ADX curve as it falls below the 25 mark. The token price can be seen bouncing off the demand zone if the bulls overpower the bears. If the same happens the ADX curve can also be seen moving upwards supporting the trend. As of, now the ADX curve has turned upward indicating a halt in the price movement and a change in price structure.
CONCLUSION: The HUOBI token price is trading below the demand zone, as it failed to surpass the supply zone due to a bearish trend. The technical parameters are also indecisive as the token price consolidates.The token price failed to sustain at the long term demand zone resulting in the breakdown of it. The token price is now retesting the breakdown zone. If bulls font overpower the bears , the token price can be seen falling continuing the bearish trend.
SUPPORT: $3.80 and $3.40
RESISTANCE: $4.5 and $4.9




