Universal High Income
 OnlyAgent
 Aerodrome Finance
 Pudgy Penguins
 Monero
 Pearl
 Quantus

- Polkadot Price gets sharp rejection from $7.00.
- The DOT price rejected the 200-day EMA and dropped below the 50 day EMA.
- Polkadot crypto price fell 13% on a weekly basis.
Polkadot Price recorded a 13% fall this week and got rejected from the 200-day EMA. It shows that correction has begun and that the positional trend is now in the downward direction. DOT price witnessed profit booking and prices dropped below the 50 day EMA hurting investor sentiments. However, the prices are near the demand zone and downfall may take halt.
Polkadot Price is trading at $5.942 with an intraday decline of -0.12%. The 24 hour volume to market cap ratio stands at 0.0163. The pair of DOT/BTC is trading at 0.00021498 with an intraday rise of 0.48%. The chart structure of the DOT/BTC is in a downtrend and looks weak as compared to the USDT pair.
Mid-February, DOT price failed to break the $8.00 hurdle level. Later, DOT price began to decline by forming lower-lows and lost the majority of the previous gains. The downfall halted near $5.00 and prices formed a bullish hammer candle creating hopes for a bullish trend reversal. Slowly and steadily, Polkadot price recovered nearly 25% but the momentum was lost near $7.00 and triggered profit booking.
Will Polkadot Price Recover or is More Downturn Likely?
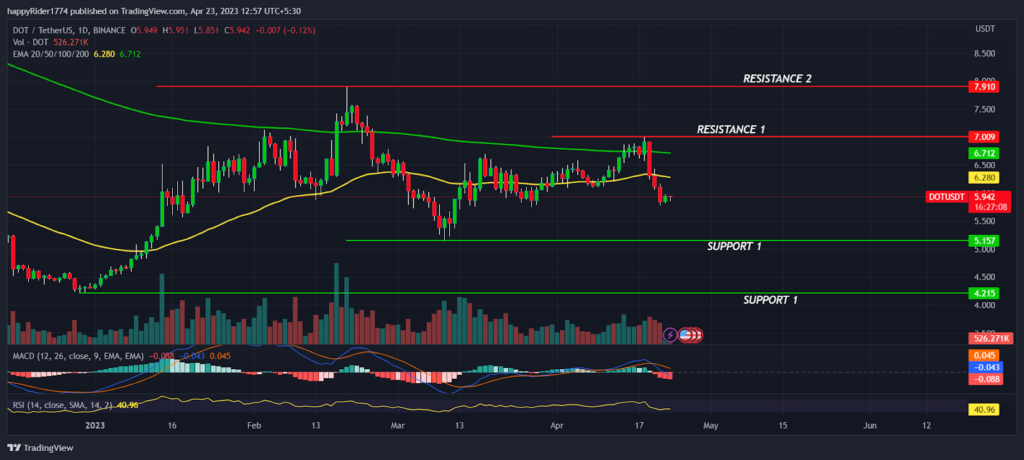
Polkadot Price prediction suggests a rise in the long term and minor correction will have a high probability of bounce back. Therefore, till DOT price sustains above $5.00, the downside seems to be limited.
Presently, DOT price is 20% (approx.) away from $5.00. So bearish momentum might continue for some more time. Technical analysis suggests that Polkadot price is in a short-term downtrend and that the bears might try to test the previous lows. On the other hand, if the sell-off continues and the price drops below $5.00, then it could concern investors.
DOT Price Near Oversold Territory
DOT price is forming a bearish engulfing candle pattern on a weekly time-frame. It has eroded the gains of the past five weeks and is trading near the monthly low. However, the price is in the oversold territory and a relief rally may be triggered anytime from lower levels.
The Polkadot price had formed a strong base at $5.00. It will be difficult for the sellers to break down the important support level. The technical indicators like MACD have generated a negative crossover and histogram bar is declining. It indicates that the prices are likely to trade with bearish bias. The RSI at 40 sloping sideways denotes mild weakness and that the prices might try to test the neutral territory.
Conclusion
Polkadot Price witnessed profit booking this week. It slipped below the 50 day EMA pushing investor sentiments. However, DOT formed a strong base near $5.00 and further downside seems to be limited.
Technical levels
Resistance levels : $7.000 and $8.000
Support levels : $5.000 and $4.215
Disclaimer
The views and opinions stated by the author, or any people named in this article, are for informational purposes only. They do not establish financial, investment, or other advice. Investing in or trading crypto assets comes with a risk of financial loss.