
 Minter
 Sui
Sui Pons
Pons NEAR Protocol
 Starknet
 Quack AI
 Chainlink
- AMZN stock shows recovery from the lows in the past weeks.
- Bulls are now looking for a rally in the upcoming sessions.
Amazon Inc. ( AMZN) stock shows a rounding bottom pattern and depicts recovery on the charts. Furthermore, a base buildup process was seen in the past months, and stock retested and bounced from the demand zone of $80 during the start of 2023. Afterward, AMZN recovered gradually and is now on the verge of the most awaited breakout of the rounding bottom pattern, with the neckline resistance mark at $130.
The price action shows that bulls are gaining strength and have the momentum to escape the ongoing hurdle. Moreover, buyers have noted accumulating the stock and looking for an upcoming breakout.
Furthermore, AMZN stock replicates a trend reversal, is in recovery mode inside the rising channel, and heads toward the resistance of $130. Moreover, AMZN stock started to trade above the significant moving averages and intended to retest the higher swings and the sweet spot of $150 soon.
Amazon.com, Inc. offers a range of products and services through its Websites. The Company’s products include merchandise and content that it purchases for resale from vendors and those offered by third-party sellers.
Furthermore, it manufactures and sells electronic devices, including Kindle, Fire tablet, Fire TV, Echo, Ring, and other devices, developing and producing media content.
At press time, AMZN stock was trading at $125.30 with an increase of 0.25%, showing a continuation and follow-on buying sequence. The intraday trading volume was also noted at 47.95 Million.
Daily Charts Shows Rounding Bottom Pattern
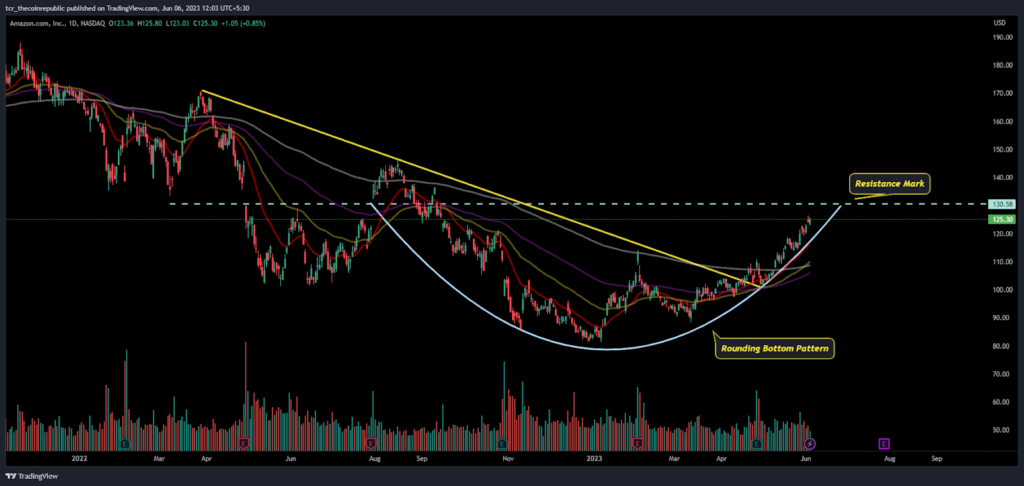
On the daily charts, Amazon stock is peaking bullish from last month, when stock attained a bounce from the round level of $100, and sellers were trapped over there. Afterward, mature investors made long positions in the stock and pulled beyond the 20-day EMA.
However, AMZN stock is near the hurdle, with buyers looking to break and sellers who maintained their grip are now pretending to be unsafe.
Short Term Charts of AMZN stock
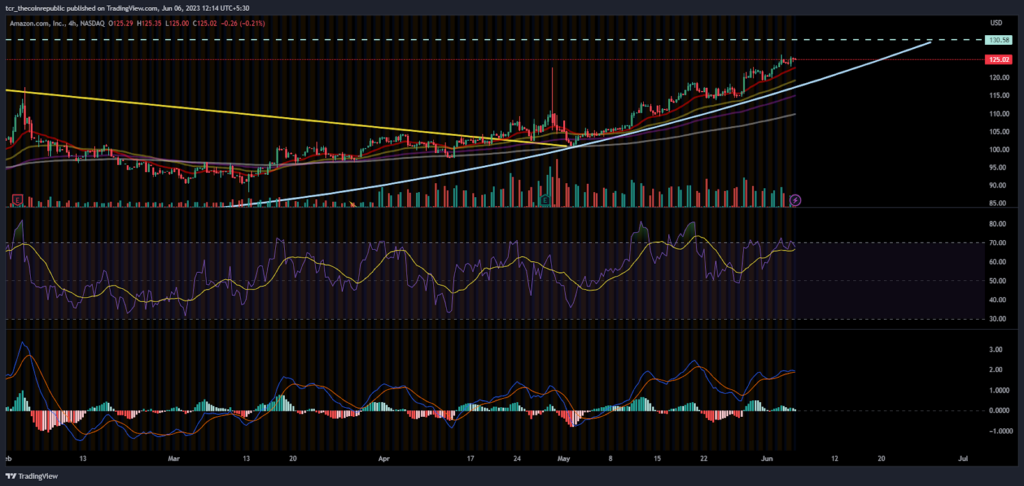
On the short-term charts, AMZN stock is retesting the hurdle of $125, where the stock was rejected in the last weeks during the earning day trading session, where a rejection candle with a long wick was formed. Now, AMZN stock was retesting the mark and peeking to cross the mark above $130.
The RSI is sailing near 70 and above the neutral level, with a positive divergence noted earlier. Moreover, it gave bullish cues with further bullishness still there.
The MACD indicator shows a bullish crossover and indicates a positive outlook. The green bars are plotted on the histogram and replicate buying signals.
Conclusion:
Amazon stock (AMZN) price is near to register a breakout above $130, which buyers have kept an eye on the mark.
Technical Levels
Support Levels: $120
Resistance Levels:$132
Disclaimer
The views and opinions stated by the author, or any people named in this article, are for informational purposes only and do not establish financial, investment, or other advice. Investing in or trading crypto assets comes with a risk of financial loss.




