
 Dacity Coin
 Celestia
 Solana
 Injective
 Quantus
 Sei
Sei Pudgy Penguins
- CFX token is hovering near its crucial support mark of $0.2200.
- Bulls are trying to hold the selling pressure of the mighty bears.
Conflux Network token price is near 200 days EMA struggles to hold the selling pressure from the last trading sessions. The price action shows the volatility in the previous sessions due to the negative outlook and seller engagement in the token. The mighty bears show their presence and continue to make short positions in the token. Moreover, the buyers are trying to reclaim the momentum and are willing to hold the downtrend till the 200-day EMA. However, the price has put on support and forms a Doji candle on that mark, which shows that there may be a bounce happening in the near-term sessions.
Moreover, the price action shows that a breakdown of the symmetrical triangle pattern was noted in the past trading sessions when the token broke the lower trendline at $0.3100 and formed a double top pattern which indicates bearishness in the token.
However, the volatile action shown on the charts reacted to a conservative move of investors.
As per the recent move, the token faced a supply mark and showed a rejection from $0.4500, which was the distribution range, and the token started to decline from those marks. Moreover, the pattern showed that the price is at the lower Bollinger band, where a decisive move was yet to be granted.
When writing, the CFX token trades at $0.2326 with an intraday gain of 1.92%, showing a bounce from the 200-day EMA. Moreover, the pair of CFX/BTC is at 0.0000087 BTC, and the intraday trading volume increased by 9.70% to $63.70 Million. The day high of CFX is $0.2352, and the day low is $0.2251. The market cap of CFX is $157.17 Million.
Will CFX hold a 200 day EMA?
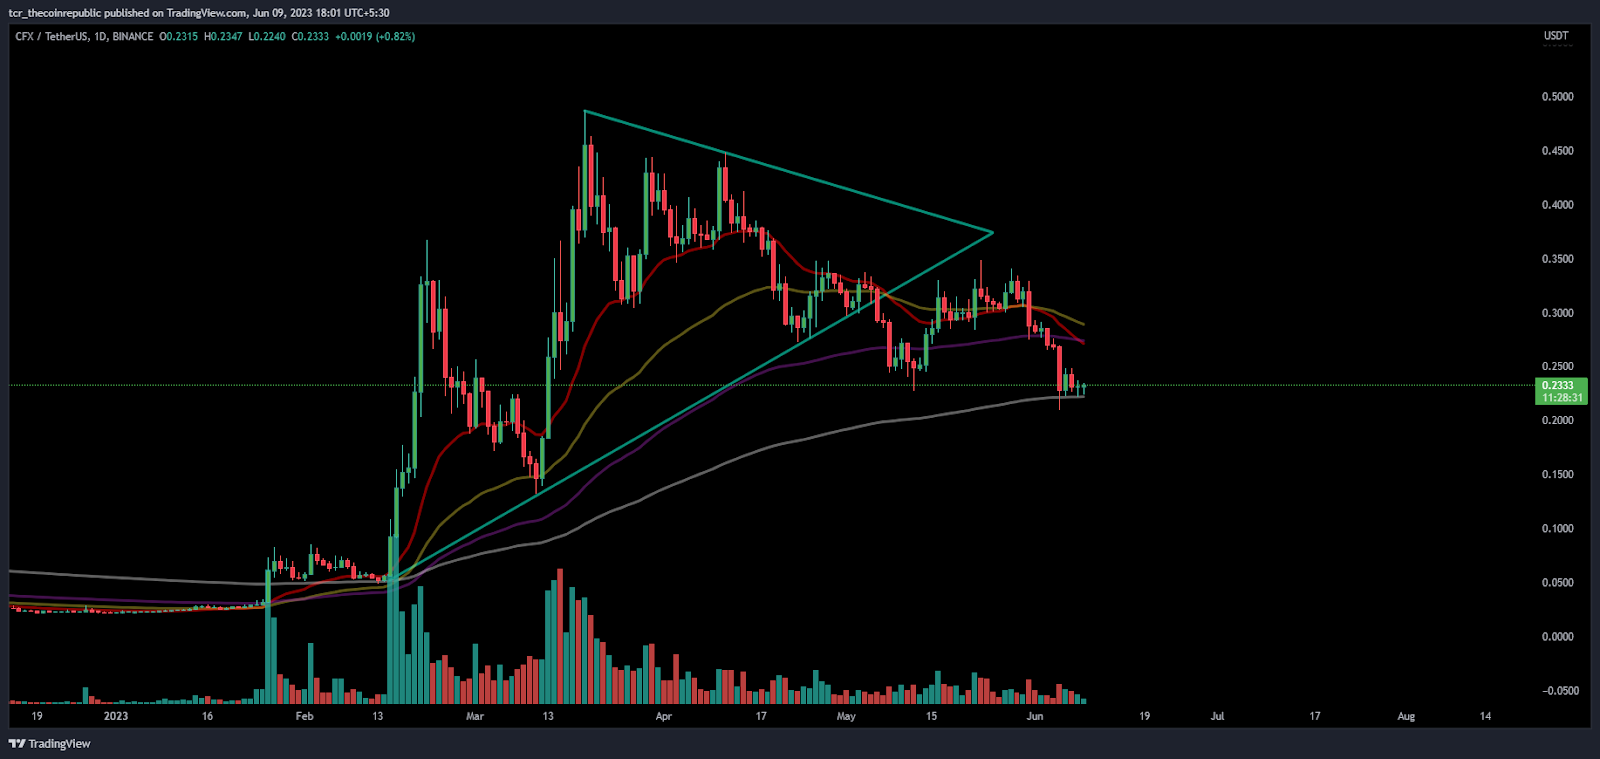
On the daily charts, the CFX token showed hawkish selling pressure this month and a lower lows sequence before the supply mark of $0.3500, where sellers dragged the token towards the bottom. Although, the token paused near the 200-day EMA, which is the last stoppage of the token.
If further selling in the token happens, then the token will lead toward the secondary support of $0.2000. On the other hand, if any bounce in the next session happens, then the 20-day EMA will act as a resistance mark.
What Technical Indicators Say?
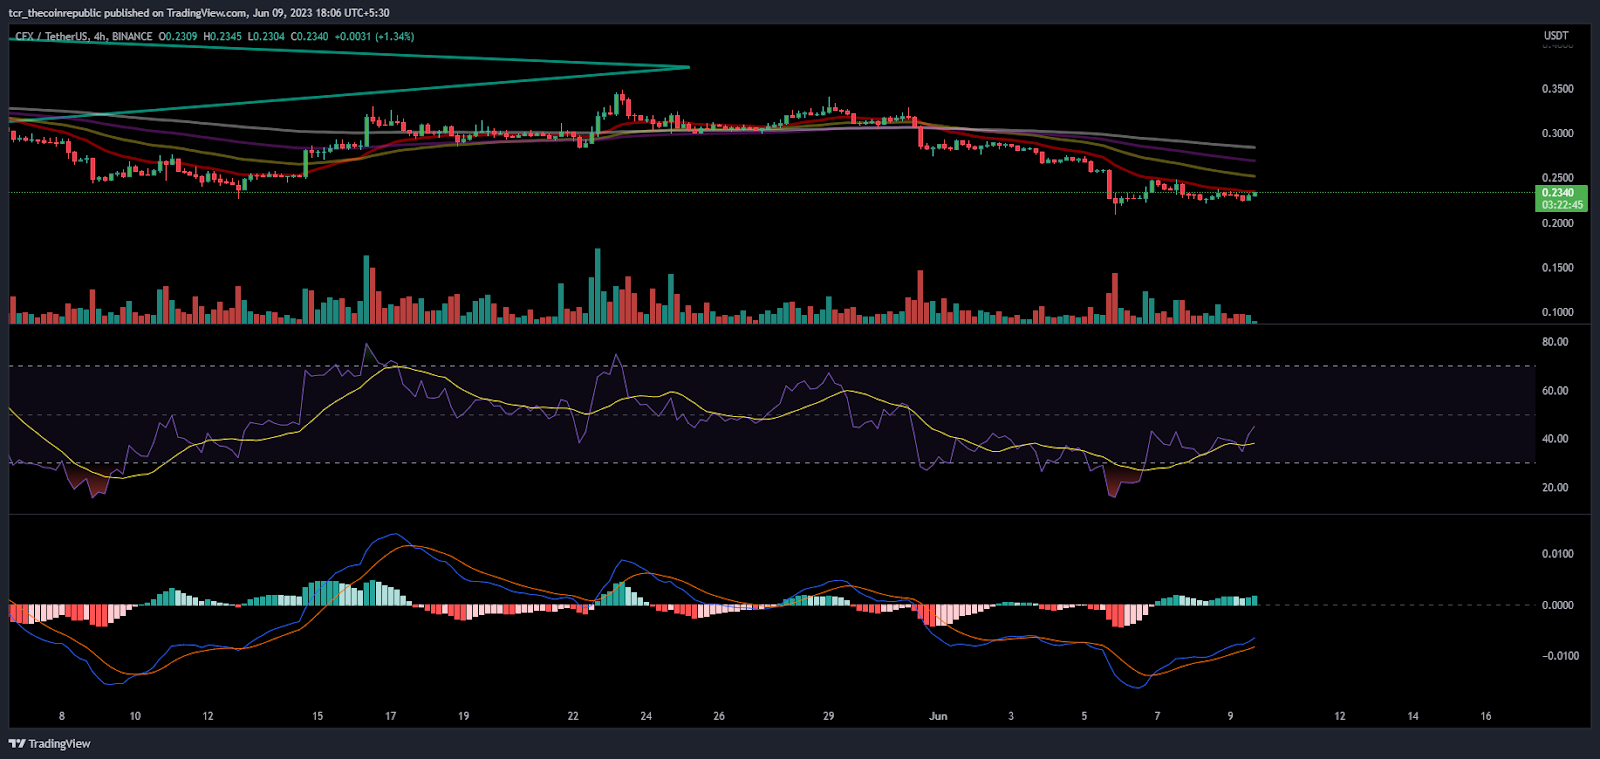
On the 4-hour charts, the token is on the 23.6% Fib level, which could be the mark where buyers find some momentum and lead the charge again to pump up the gains. Furthermore, if any breakdown below the mark happens, there will be new signals of a downtrend.
The RSI shows an up move above the neutral mark, and a positive crossover was noted. Furthermore, the MACD indicator also shows green bars showing a bullish crossover.
Conclusion:
CFX token is on the verge of the 200-day EMA, which could be a make-or-break level for the token.
Technical Levels:
Support Levels:$0.2000
Resistance Levels:$0.2800
Disclaimer
The views and opinions stated by the author, or any people named in this article, are for informational purposes only and do not establish financial, investment, or other advice. Investing in or trading crypto assets comes with a risk of financial loss.




