
 Bitcoin
 Ondo
Ondo NEAR Protocol
 Walrus
 Pearl
Pearl Pons
Pons Ethereum
- MKR price reversed from the demand zone of $500.
- Bulls showing their intent and willing to gain strength.
Maker price is showing a rebound from the support mark and trying to attain strength.Bulls are showing their interest and formed a long legged doji candlestick on the charts.
Maker Token Price was shown a negative outlook from the past weeks due to the selling pressure and downtrend of the token price. Afterwards, a falling wedge pattern was formed on the chart. Moreover, the token was unable to break the highs and showed rejection from the supply zone. The range between $500 – $700 is the ideal congestion zone.
Moreover, the sellers continue to put pressure on bulls and price also retested the strong support mark of $500 and reversed from there in the intraday trading session.Although, buyers noted with accumulating the token to fetch 20 day EMA to attain fresh momentum.
When writing, MKR token trades at $635 with an intraday gain of 1.64% showing neutral indications. Moreover, the pair of MKR/BTC is at 0.02459 BTC, and the intraday trading volume increased by 3.50% to $20.38 million. The day high of MKR is $645.20 and the day low is $620.00 The market cap of MKR is $621.00 Million.
Daily Charts of MKR Token
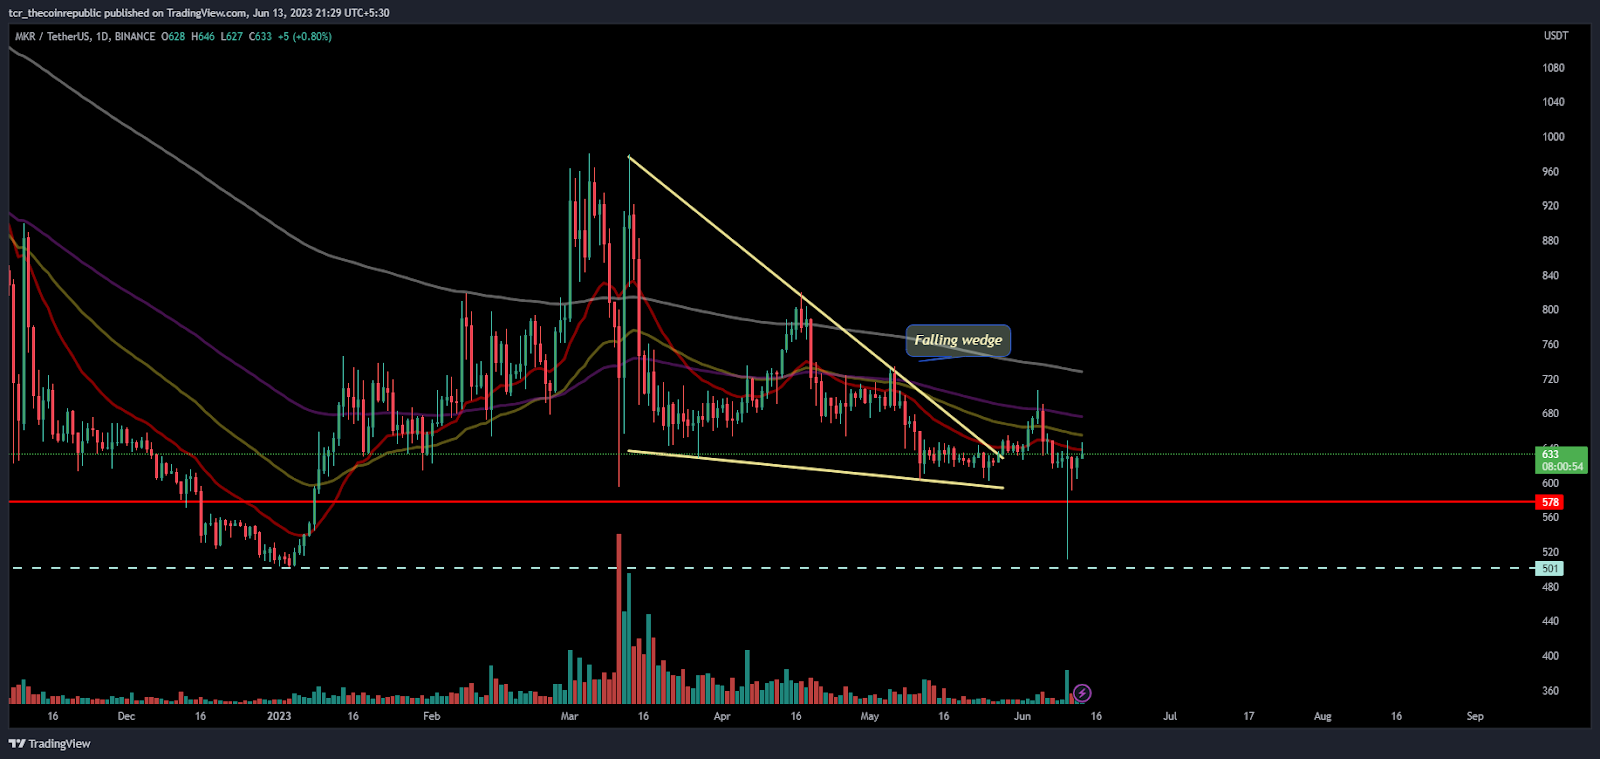
On the daily chart, the Maker token is forming a falling wedge pattern, but due to the sellers engagement in token, MKR shows a downward move and noted with a fall instead of an uptrend. Afterward, token slips below the key EMA and below the support of $550 and retested the mark of $500.Although, buying conviction was there in the upcoming session based on the price action formation.
Moreover, the bollinger band also shrinks and showed a converging move which suggest a bigger moves in the upcoming session either in the form of breakout or breakdown.The token has a trajectory of $680 and followed by $700,on the higher side, whereas on the lower side of $600 is the crucial support and below than $580 between those trajectories the token will be react as an important marks in the next following sessions.
What Technical Indicators Say
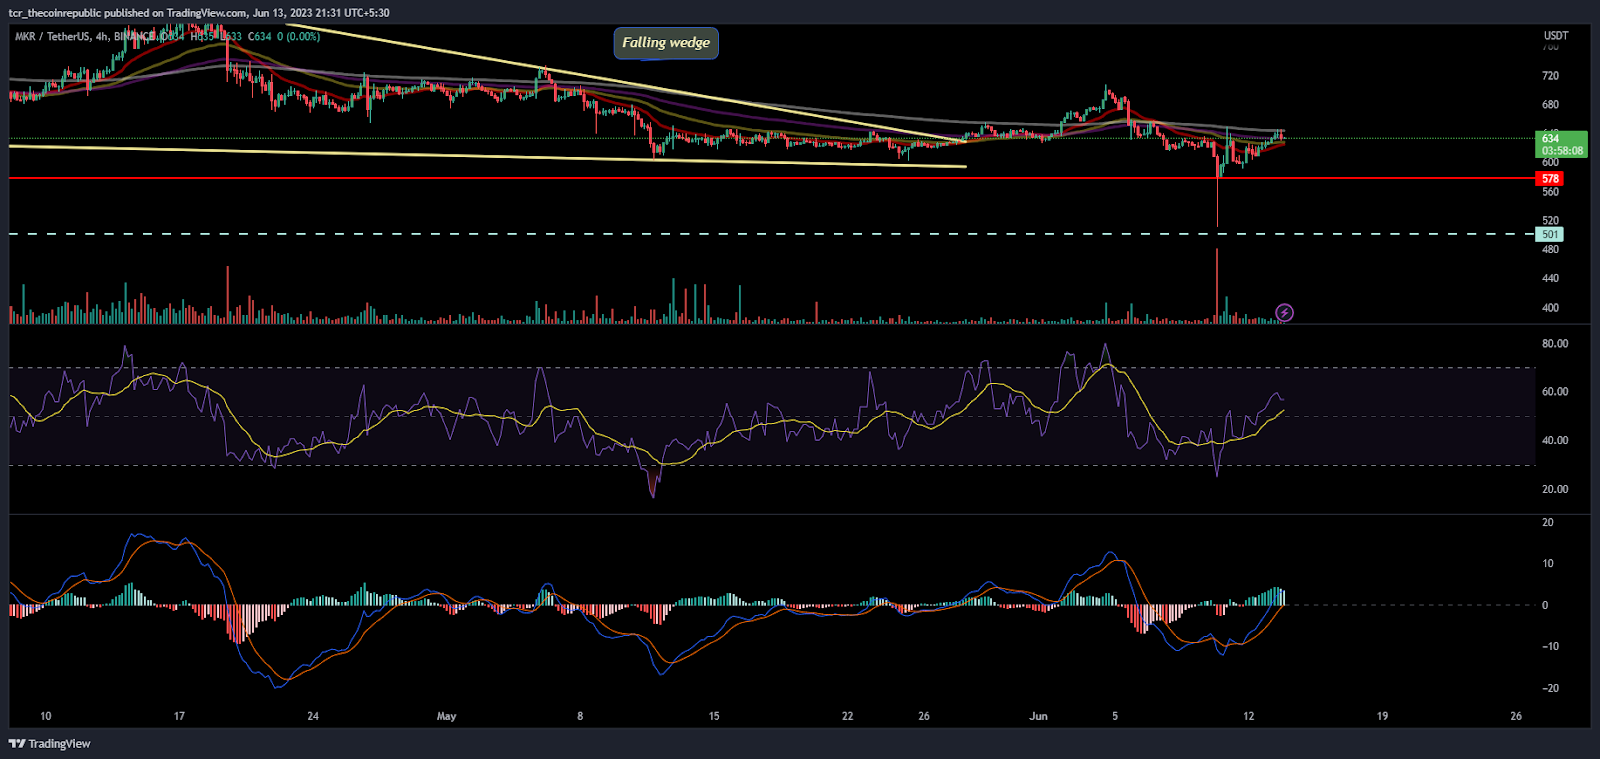
On the 4-hour charts, Maker token price is showing a rebound from $500 and trades near the 20 day EMA ( Exponential moving averages).. Recently, the token slipped from the supply mark of $650,and noted a fall towards $500
The RSI sharply jumped from the oversold region and hovered near 50 noted with a positive crossover.
The MACD crossover also began with green bars on the histogram and shows a bullish crossover.
Conclusion:
Maker token noted with a rebound in the last sessions showing a long legged doji candlestick which shows the intention of bulls and their willingness to attain above 20 day EMA.
Technical levels
Resistance levels: $680 and $700
Support levels: $600 and $580
Disclaimer
The views and opinions stated by the author, or any people named in this article, are for informational purposes only. They do not establish financial, investment, or other advice. Investing in or trading crypto assets comes with a risk of financial loss.




