Universal High Income
 OnlyAgent
 Aerodrome Finance
 Monero
 Pearl
 Axis Robotics
 Quantus

- ETC shows breakdown and hovering near the support mark.
- Bulls looking hopeless in the recent trading sessions.
ETC coin showed breakdown after a long narrow range bound move and sellers are now gaining momentum making short positions in the last trading sessions.
Moreover, the narrow range bound move of the coin dropped the trading volume, which resulted in a hovering of coin.
ETC coin is now trying to consume the selloff and looking to retain the gains in the last session with a justification of a long wick candle which shows the buyers intent.
However, ETC showed a negative outlook based on the price action with an ongoing seller’s attachment. If ETC fails to hold the current price level and falls below the support zone of $12, then further down move can be seen toward the strong support mark of $10
The price action shows that bulls lost the battle and sellers led the advantage by breaking the lower neckline of the consolidation phase by massive volume addition.
When writing, ETC trades at $14.77 with an intraday drop of 3.82% showing bearish indications. Moreover, the pair of ETC/BTC is at 0.000594 BTC, and the intraday trading volume increased by 5.60% to $175.65 million. The day high of ETC is $15.34 and the day low is $14.62 The market cap of ETC is $2.09 Billion.
Will ETC breaks the consolidation zone
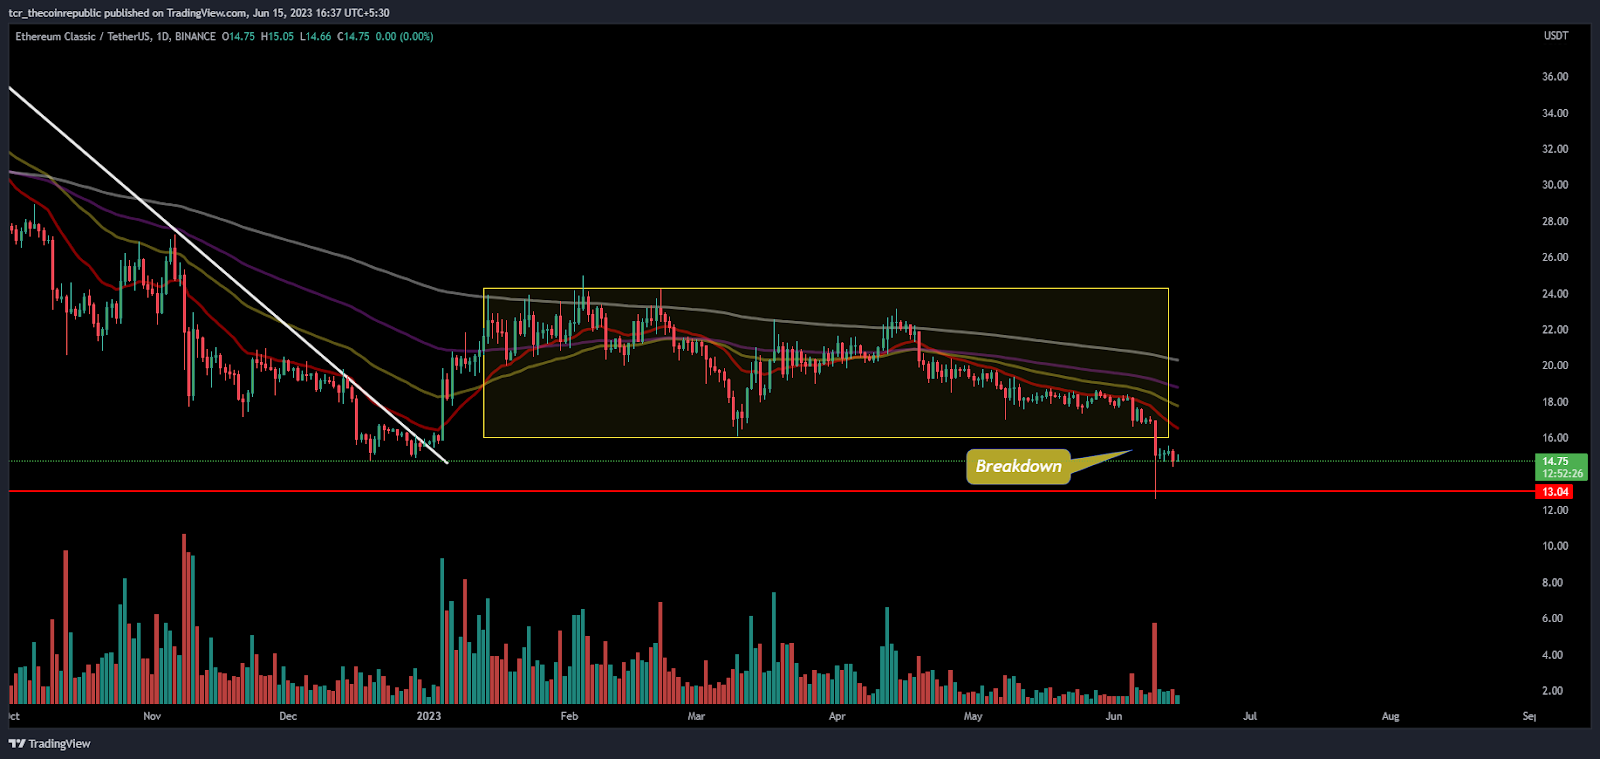
On the daily charts, ETC showed a breakdown after staying long in a narrow range, but sellers succeeded in their mission and led the downmove.
However, ETC retested the demand zone and showed a long legged bearish candle with a wick which shows the intent of bulls.
Although, after a decline, price hovered in the congestion range and battle between the bears and bulls was at an exciting stage where a further decisive move was near to happen. Moreover, the ongoing downtrend shows the dominance of sellers and bulls are weakening the momentum and slipping the gains.
However, gradual accumulation from the support mark of $12 showed buyers’ interest in the coin and ETC willing to pump up the gains in the near term.
Moreover, trajectory swings shows that if further selloff happens then ETC will again retest the mark of $12 and follow to $10.
What Traditional Indicators Say?
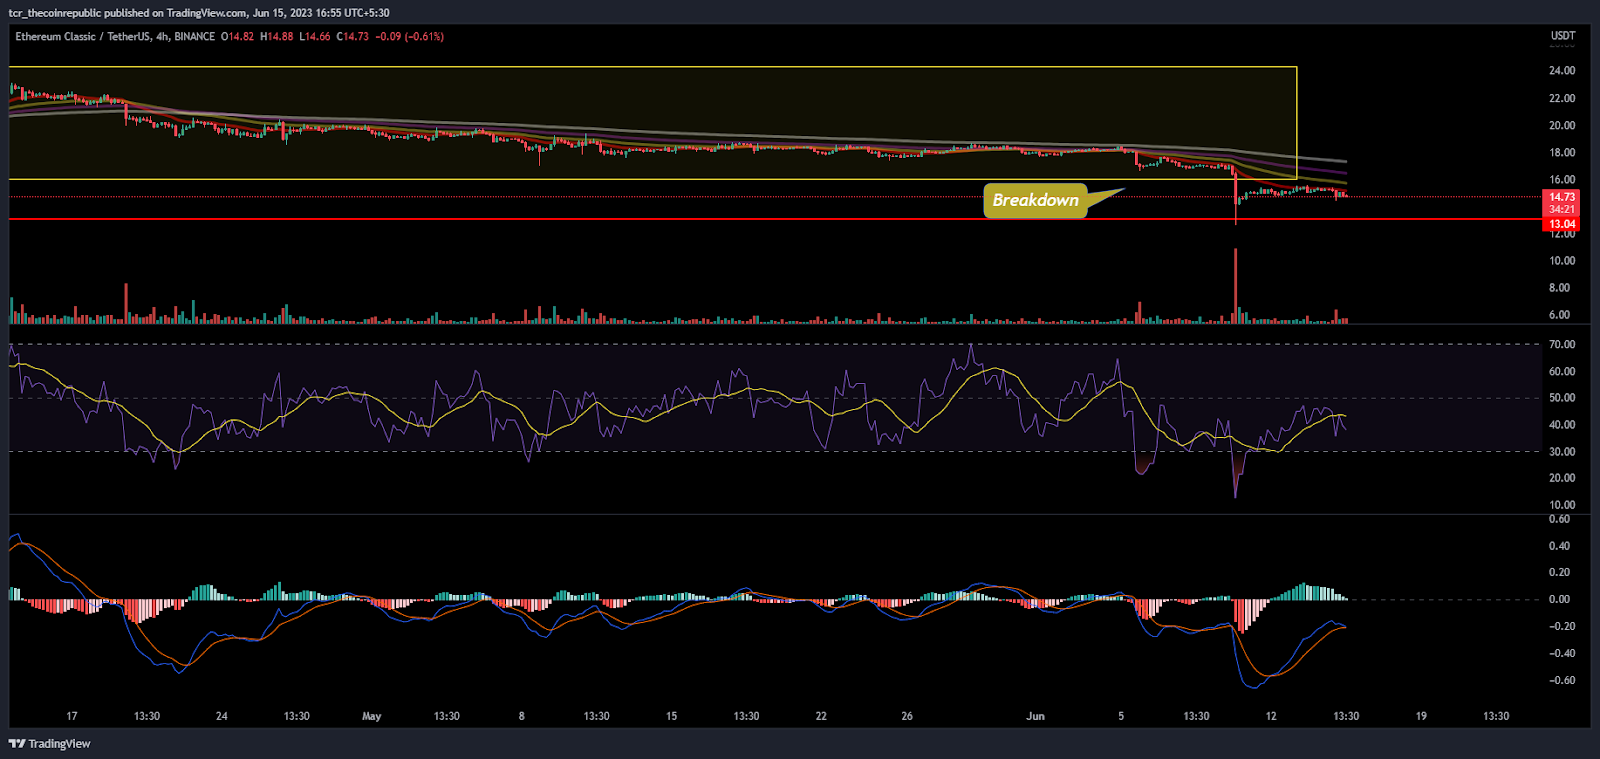
On the 4 hour charts, ETC showed a neutral perspective amid the breakdown in the recent trading sessions.
The technical parameters are showing a reversal indication but bulls need to regain the shape to initiate the reversal move in the next sessions.
Moreover, the price action shows that bulls gain extensive momentum, then sustaining above $15 is important to gain further.
The RSI showed a rebound from the oversold region and stayed below neutrality.
The MACD indicator showed a bullish crossover in the past trading sessions and floated green bars on the histogram.
Conclusion:
ETC price shows a pessimistic view and hovering near the support mark and below the 20 day EMA mark
Technical levels;
Support Levels: $12
Resistance Levels:$20
Disclaimer
The views and opinions stated by the author, or any people named in this article, are for informational purposes only and do not establish financial, investment, or other advice. Investing in or trading crypto assets comes with a risk of financial loss.