
 Quack AI
 Bitcoin
 Lighter
 Injective
 Pearl
Pearl Zcash
Zcash Sui
Sui
- Ford Stock (NYSE: F) up 20% in the current month and formed a bullish pattern.
- F Stock Price sustains above 50 and 200 day EMA and might display a golden crossover.
- Ford Stock attempting to break out of the 8 months consolidation.
Ford Stock Price (NYSE: F) up by 20% in the current month and trading near to the 8 months high. It showed a sharp recovery from the lower levels and rising upward by forming higher high candles.
Ford stock price sustained above the 50 and 200 day EMA shows the positional as well as short term trend has reversed upward. The EMA might display a golden crossover which will boost the confidence of long term investors.
From the past eight months, Ford Stock Price is consolidating in the wide range between $11.00 to $14.50. It seems like stock has formed a strong base and buyers are preparing to expand the range upward in the coming week.
Previously, buyers had tried twice to break the higher range but got rejected. It shows that strong sellers are active in the supply zone. However, the recent up move looks powerful and the possibility of breakout remains high.
Ford Stock Price closed the previous session at $14.45 with an intraday rise of 1.76%. The market capitalization stands at $57.81 Billion.
Will the Ford Stock hit a new 52 week high soon?
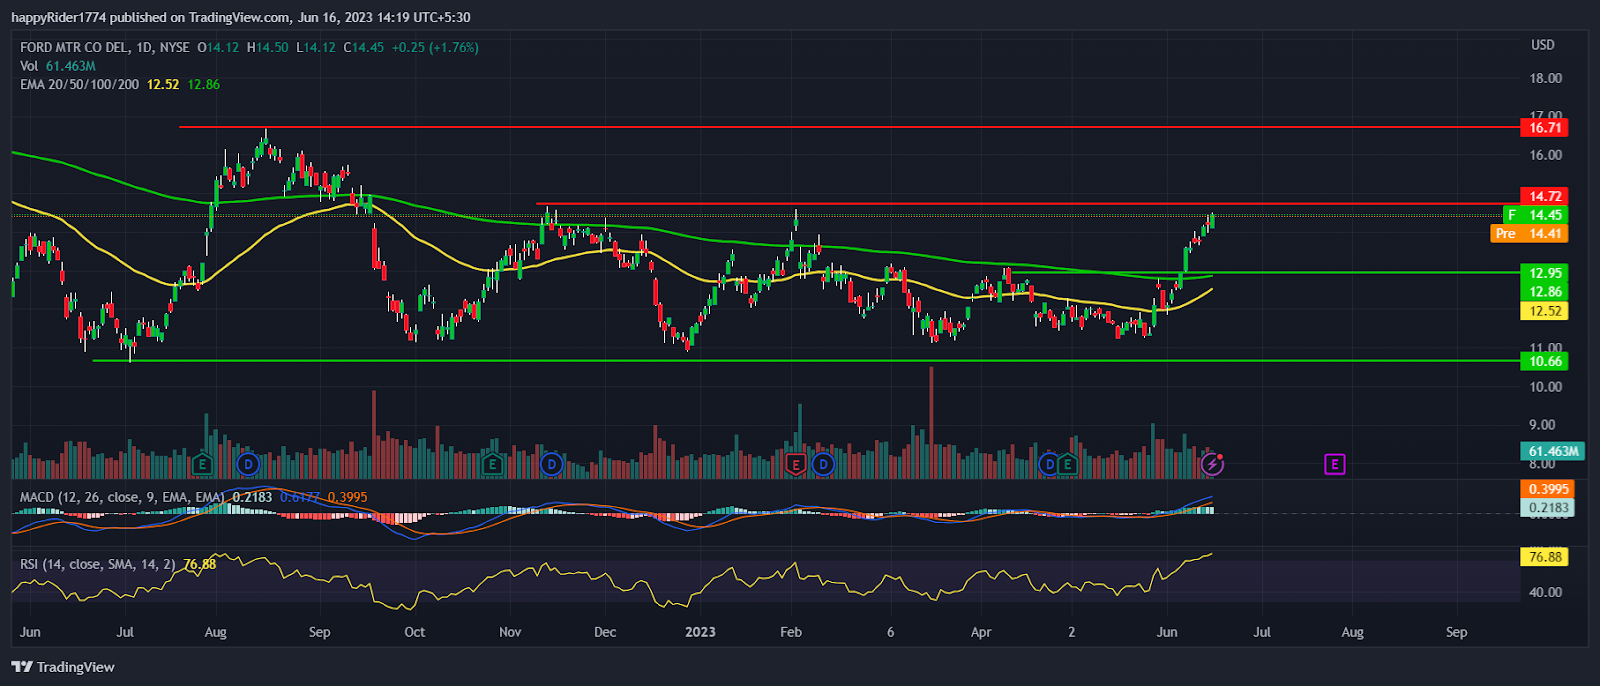
Ford Stock Price displayed a V-shaped recovery and up by 23% on YTD basis. After consolidating for a long period finally F stock is showing signs of breakout. However, the prices seem mildly stretched So, it might trade range bound for a few days near the supply zone.
On the other hand, if the price faces rejection then it might retrace toward the 50 day EMA. Till Ford stock price is sustaining above the $12.50 any short term retracement will be easily absorbed.
However, if the price drops below $12.50 then sellers will take the control and drag the price to yearly lows. The technical analysis suggests, Ford stock price is in a strong momentum and might show a sharp up-move after the breakout.
F Stock Price Analysis on weekly time frame
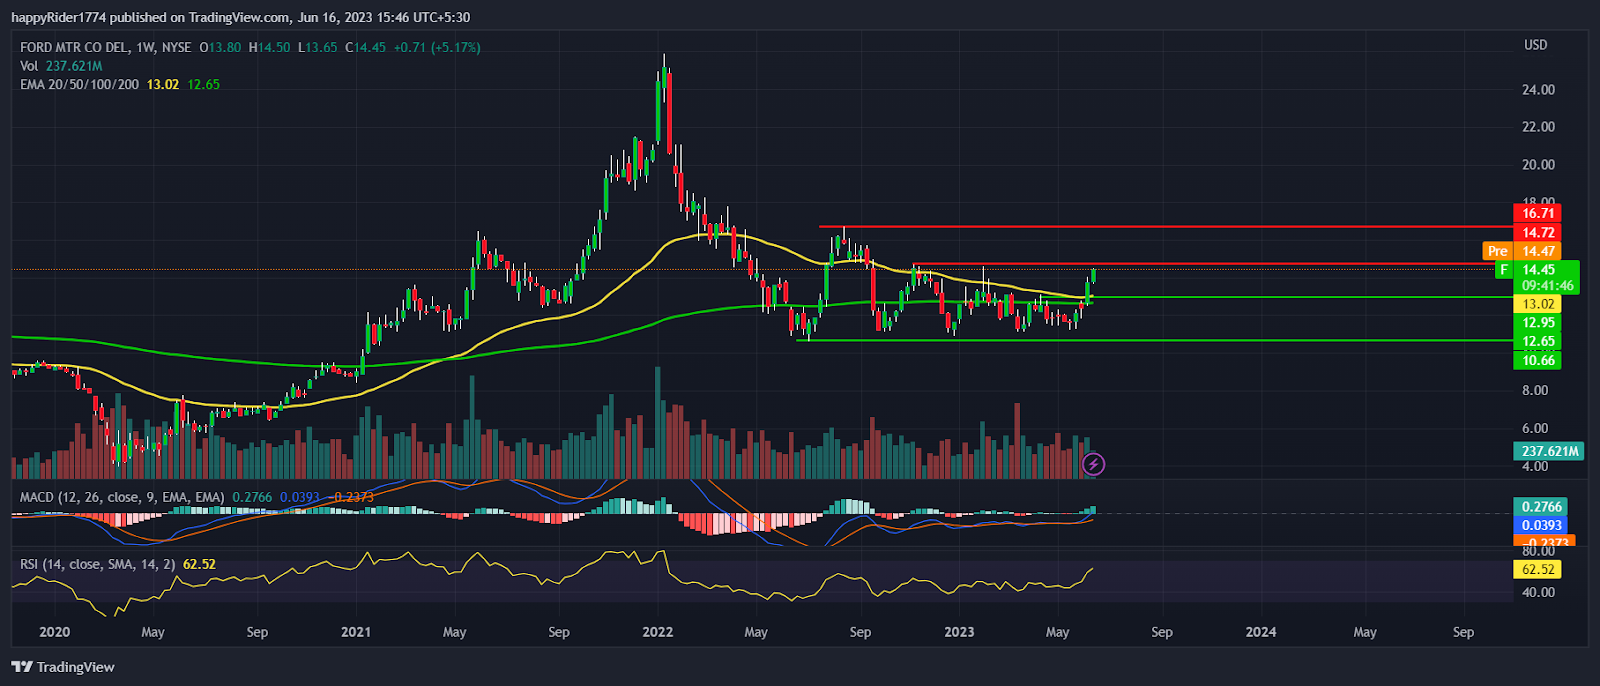
F Stock Price up by 5% in the current week and succeeded to break the previous week high. It trades above the 50 and 200 week EMA denotes trend has turned bullish on a higher timeframe.
On a daily chart, the MACD curve is rising upward and displays a sharp positive crossover. It indicates that buyers are more aggressive as compared to sellers and the rally might continue for a few more weeks.
The RSI at 76 sloped upwards denotes the strength of bulls. However, the price is near to overbought territory which may become a matter of concern for bullish traders.
Conclusion
Ford Stock Price (NYSE: F) up by 20% in the current month and preparing to break the 8 months high. However, if prices face rejection and retrace downward then the 50 day EMA will act as support.
The technical analysis suggest, F Stock is in positive momentum and the possibility of breakout is high.
Technical levels
Resistance levels: $15.00 and $16.71
Support levels: $12.50 and $11.00
Disclaimer
The views and opinions stated by the author, or any people named in this article, are for informational purposes only. They do not establish financial, investment, or other advice. Investing in or trading crypto assets comes with a risk of financial loss.




