
 Pearl
Pearl ZKsync
 Bitcoin
 Starknet
 Quantus
 Puffer
 Lighter
- DASH/USDT has broken from the daily support level of $32.02 and is trading at it $29.95
- DASH/USDT briefly created a low at $21 and has taken a bounce of 17.60 %.
DASH is currently trading at $29.95 after it broke major support of $32. It experienced intense selling pressure which sent the price all the way to $25. But immediately bounced back to the current level which indicated that the bulls stepped in to stop the price from further falling.
Daily chart shows price creating a new low
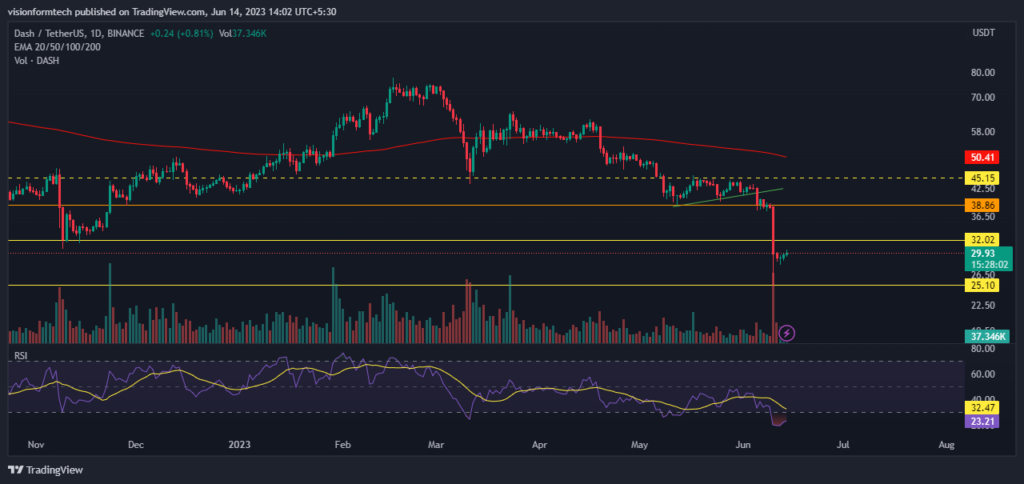
On the Daily Time frame, ever since the price broke its major daily support at $38.86, It is under selling pressure. The price is currently trading near its previous support of $32.02 level. Now it’s important to observe whether the price will breach or face resistance from this level because this may decide its course in the coming time. The High volume indicates a high level of interest for both buyers and sellers. However, after such volatility, the price of Dash is expected to consolidate before moving in any direction.
The RSI is in the oversold zone on the daily timeframe, this is a clear indication that the bulls might start to show some interest as the fear in the market can make investors greedy. It is important to note that the market must breach the level of $32 in order to change the sentiments in the short term.
Short Term Charts show a minor consolidation
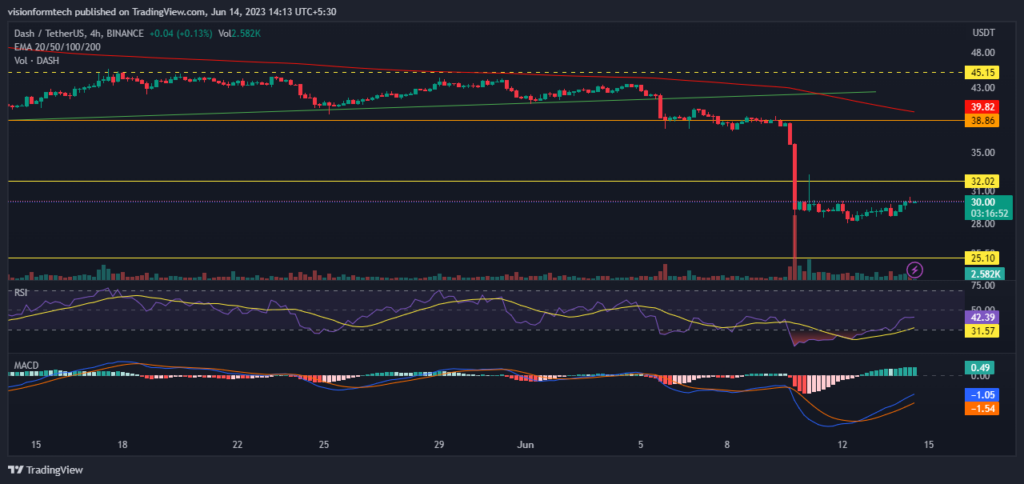
On the Shorter Time frame, the 4H chart price action is suggesting a minor consolidation after the price bounced from the low. The Overall Trend is currently bearish as the price is trading below 200 ema. The bounce is suggesting that the sellers might be getting exhausted and the market is perceiving the price to be oversold.
Consolidation is creating confusion in the market because the price is already oversold. the sellers are confused to sell further and as the downtrend continues, the buyers are also afraid of entering into new positions.
RSI: The RSI indicator is currently at 42.28 which indicates that the strength is low in the market and the bears are in control.
MACD: The MACD indicator has made a Crossover however the MACD is still below the 0 line which is indicating a bearish momentum.
200 EMA: As it is observed, on the 4hr, the price is trading below the 200 EMA(exponential moving average) which acts as a significant resistance This is a clear indication of a downtrend where the sellers are in control and in order for a trend reversal, the price must break and trade above the 200 EMA.
Technical levels :
Support Levels: $25.10
Resistance Levels: $32.02
Conclusion
The Price prediction for DASH is indicating a bounce from a newly created low. This might show that the bears are exhausted and have started booking profits and bulls have decided that the price time is oversold. Many investors are looking at this as a potential buying zone due to the low prices. However, the overall market is bearish with a sentiment of extreme fear. Investors must closely follow the market and look for more confirmations of reversal.




