
 Dacity Coin
 streamoors
 Pudgy Penguins
 Injective
 Celestia
 Sui
Sui Pearl
Pearl
- Balance Price fell 15% approx in previous week and sell off is still continuing.
- BAL Price is in downtrend and approaching the yearly lows.
- The Balancer crypto price below 50 and 200 day EMA.
Balancer price fell 15% in the previous week and corrected 43% approx from the swing high. It broke down the crucial support of $5.00 which hurted the investors sentiment and invited further decline.
BAL Price trading below 50, 200 day EMA and also displayed a death crossover. It indicates prices are in downtrend and bear continuing dominance. From the past year, Balancer Price is consolidating in the wide range between $4.00 to $8.00.
While consolidating BAL tried many times to expand the range upward or downward. But buyers succeeded in defending the lower range and sellers kept the price below the higher range.
After a long time, Balancer Price returned back to the lower range. So, it will be interesting to see how prices react. If the volume increases in the coming week then we may expect a violent reaction else it will enter narrow range consolidation.
Balancer Price is trading at $4.327 with an intraday rise of 1.43%. The 24 hour volume to market cap is 1.55%. The pair of BAL/BTC is trading at 0.0001689 with an intraday rise of 1.20%.
The price chart of Balancer with the BTC pair seems in strong downtrend and already hitting yearly lows.
Will Balancer Price reverse the trend upward?
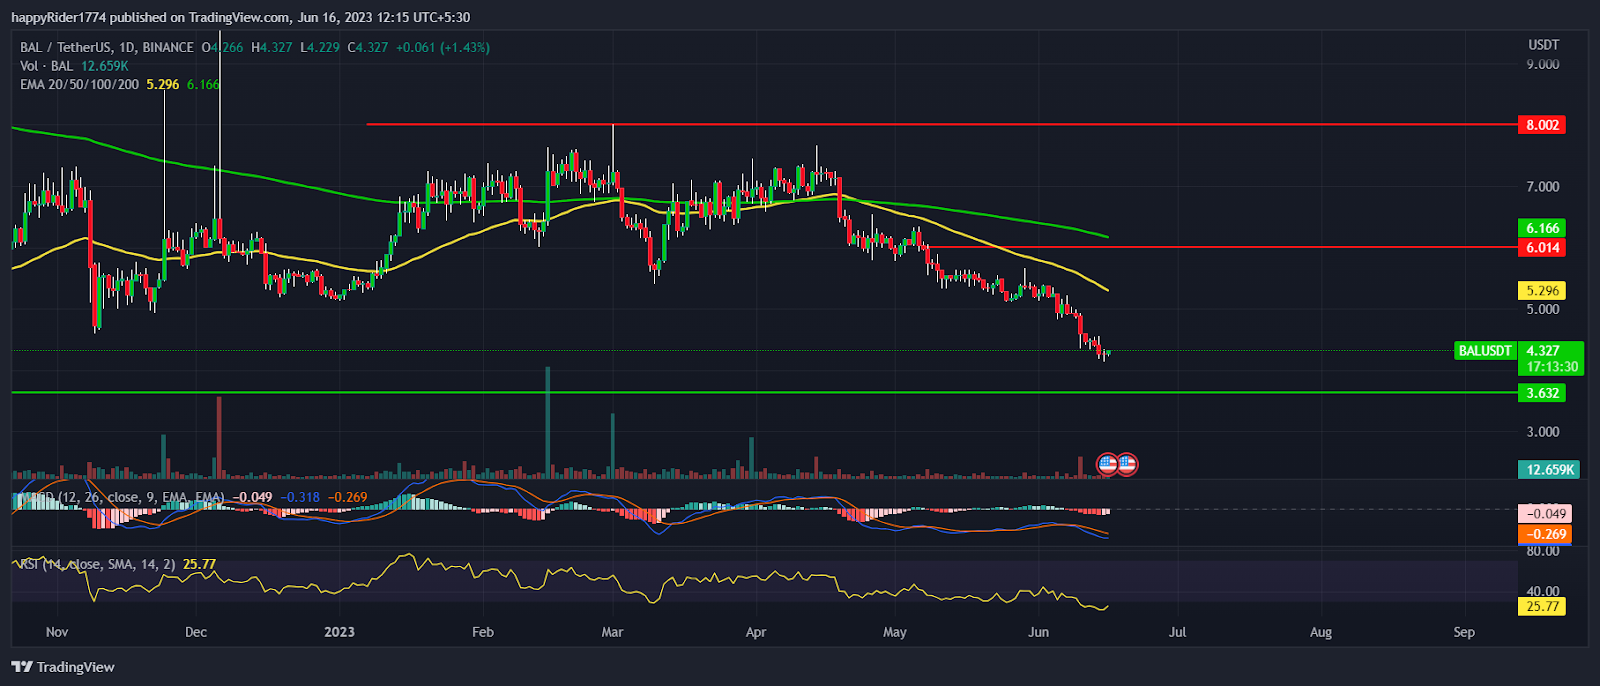
Balancer Price showed a steep fall in the previous month and downfall is still continuing. It has corrected a lot but still no signs of recovery or short term pull back is visible until it tests $4.00.
The yearly low placed at $3.632 which might act as strong support. If the buyers are able to defend the yearly lows then short covering rally will trigger and chances of trend reversal will increase.
BAL price is trading far away from the 50 day EMA, So short term pull back is possible to test the EMA. On the other hand, if the sell off continues and prices drop below $4.00 then we might see a sharp decline.
The technical analysis suggests, Balancer Price is in bear grip and probability of breakdown is high.
BAL Price Analysis: Technical outlook
BAL Price fell for 10 straight weeks and formed a bearish pattern. The recent fall is due to the sell off in across all over the crypto market. Therefore, if the overall market recovers then yearly lows might get defended.
The MACD curve intersects negatively with the moving average and the histogram bar is expanding downward. It indicates bearish momentum might continue for some more time. The RSI at 26 reached the oversold territory denotes relief rally may trigger anytime.
Conclusion
Balancer price corrected 43% from the swing high and still no signs of recovery is visible. However, The BAL price has gone far away from the 50 day EMA, so it might show minor pull back.
The technical analysis suggests, possibility of a turnaround in Balancer price is low and we may see further downside.
Technical levels
Resistance levels: $5.500and $6.000
Support levels: $4.000 and $3.632
Disclaimer
The views and opinions stated by the author, or any people named in this article, are for informational purposes only. They do not establish financial, investment, or other advice. Investing in or trading crypto assets comes with a risk of financial loss.




