
 NEAR Protocol
 Bitcoin
 Aerodrome Finance
 Pearl
Pearl Uniswap
 Quantus
 Pudgy Penguins
- The price of MX is trading at $2.615.
- The MX price increased by 0.55% in the last 24 hours.
- The MX year-to-date return is 222.10%.
Weekly Trend Analyzation
This week the trend was bullish as the price was up by 7.78%. We can say that MX performed well this week by trend and price information history.
Monthly Trend Analyzation
This month the trend was bearish as the price was down by 11.02%. We can say that MX underperformed this month by trend and price information history.
All-Time History Analyzation
The coin’s value surged by more than 72.30% in all-time history, giving high returns to the investors’ money.
Chart Analyzation In 1-D Timeframe
Trendline Analyzation
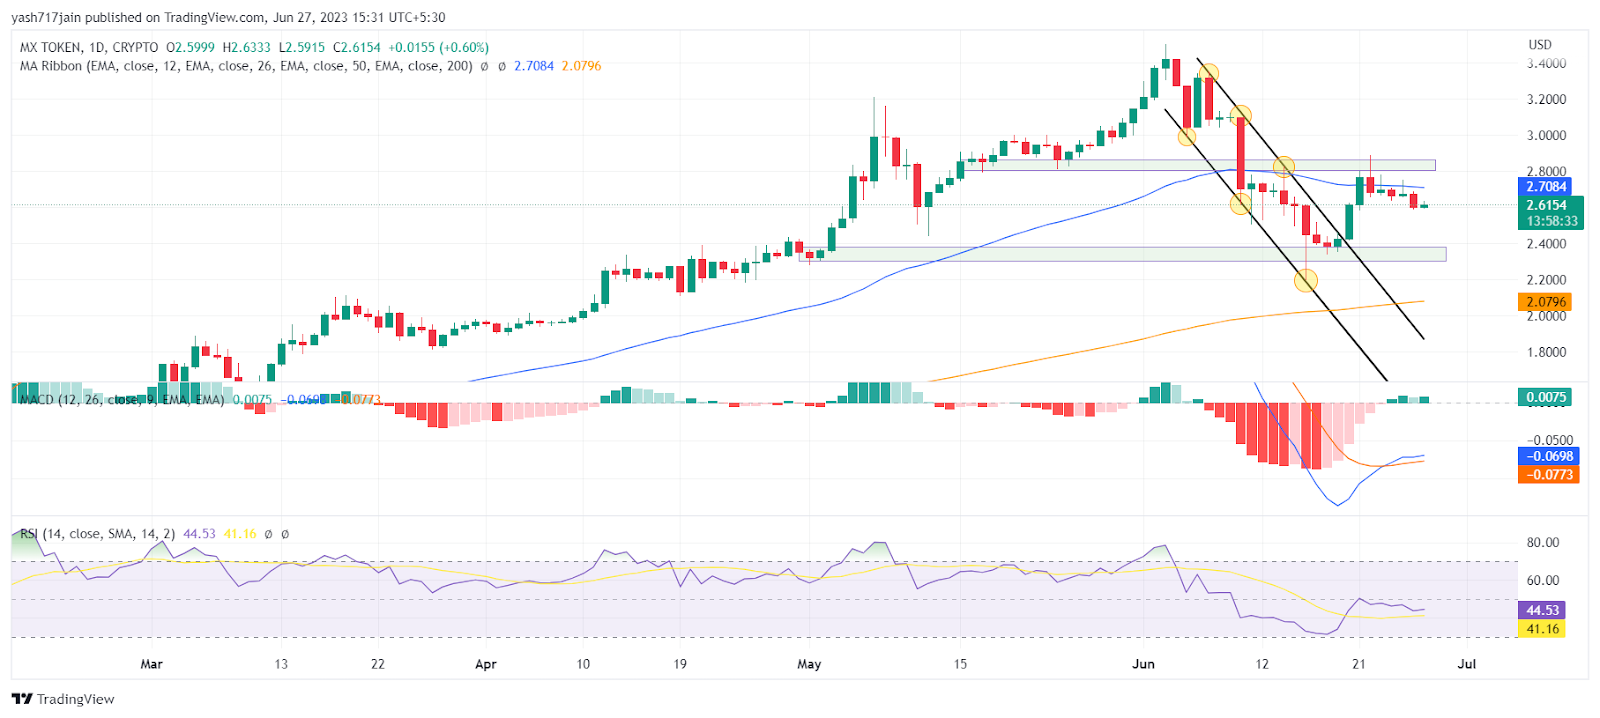
As per the trendline, it seems it is respecting multiple support and resistances very well. As observed on the chart, the MX price gave a breakout recently from the trendline and can go upwards more shortly. This appears to be bullish. So, the price of MX can reach $2.925 soon which is the nearest major resistance, and try to break the current resistance.
MACD
When the MACD line crosses above the signal line, it shows that the short-term momentum is stronger which is a bullish sign. Hence, MACD is giving bullish views on the coin.
EMA
The price stayed above 200 EMA which gives quite an idea that buyers are keeping the trend bullish in the long run. But recently we observed on the chart, 50 EMA rejected the price, this might be a temporary pullback to shoot a bull run again since there is a resistance zone ahead for that to cross the price needs momentum. This suggests that the price is entering a bullish trend; the coin’s value may grow even further in the upcoming week.
RSI
As we can see in the chart, the RSI line is in a bearish zone i.e., the line trading below the median line. Since the 14 SMA line and RSI line are below the median zone, the market is bearish for now, the RSI value is near 44. It might get the power to head upwards once the momentum comes into the market.
Bollinger Band
In the Bollinger Band indicator, the MX coin price is trading at the median which is 20 SMA. it is indicating an upward move.
Volume Analyzation
The amount of MX traded in a day is $3,193,159. It rose by 9.49% since the last day. Therefore, it can push the price up, due to considerable volume present in the market.
Conclusion
Currently, the technical parameters for the MX coin indicate bullish pressure. The views of traders and investors are bullish. If the price continues to move under the buyer’s control, it is expected to rise more from the current levels. The sentiments of investors and traders are bullish regarding the price of coins in the 1D timeframe.
Technical Levels:
- The Nearest Support level is $2.305.
- The Nearest Resistance level is $2.925.
Disclaimer
In this article, the views and opinions stated by the author, or any people named are for informational purposes only, and they don’t establish investment, financial, or any other advice. Trading or investing in cryptocurrency assets comes with a risk of financial loss.




