Dacity Coin
 Bitcoin
 Pearl
Pearl NEAR Protocol
 Quantus
 Bittensor
 Pudgy Penguins
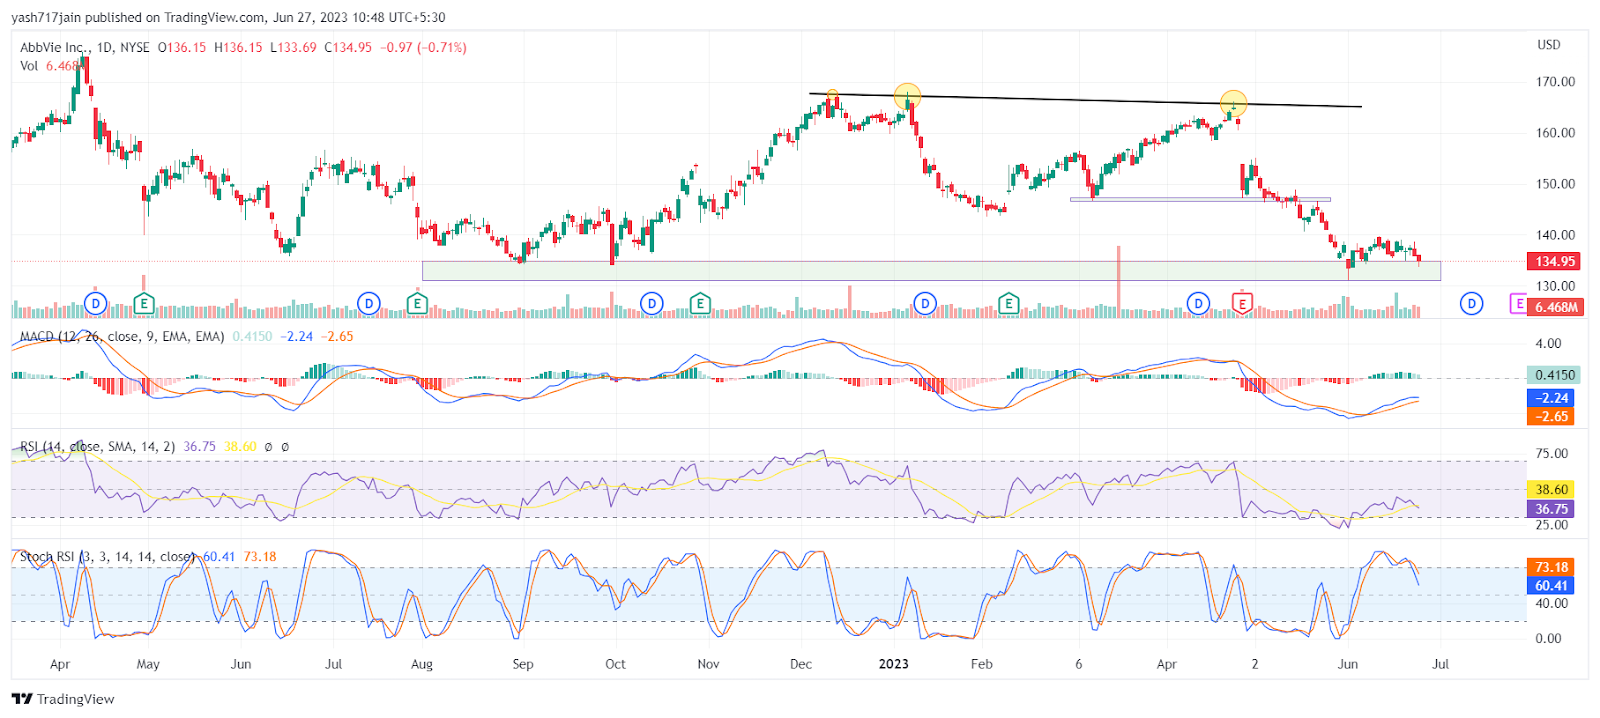
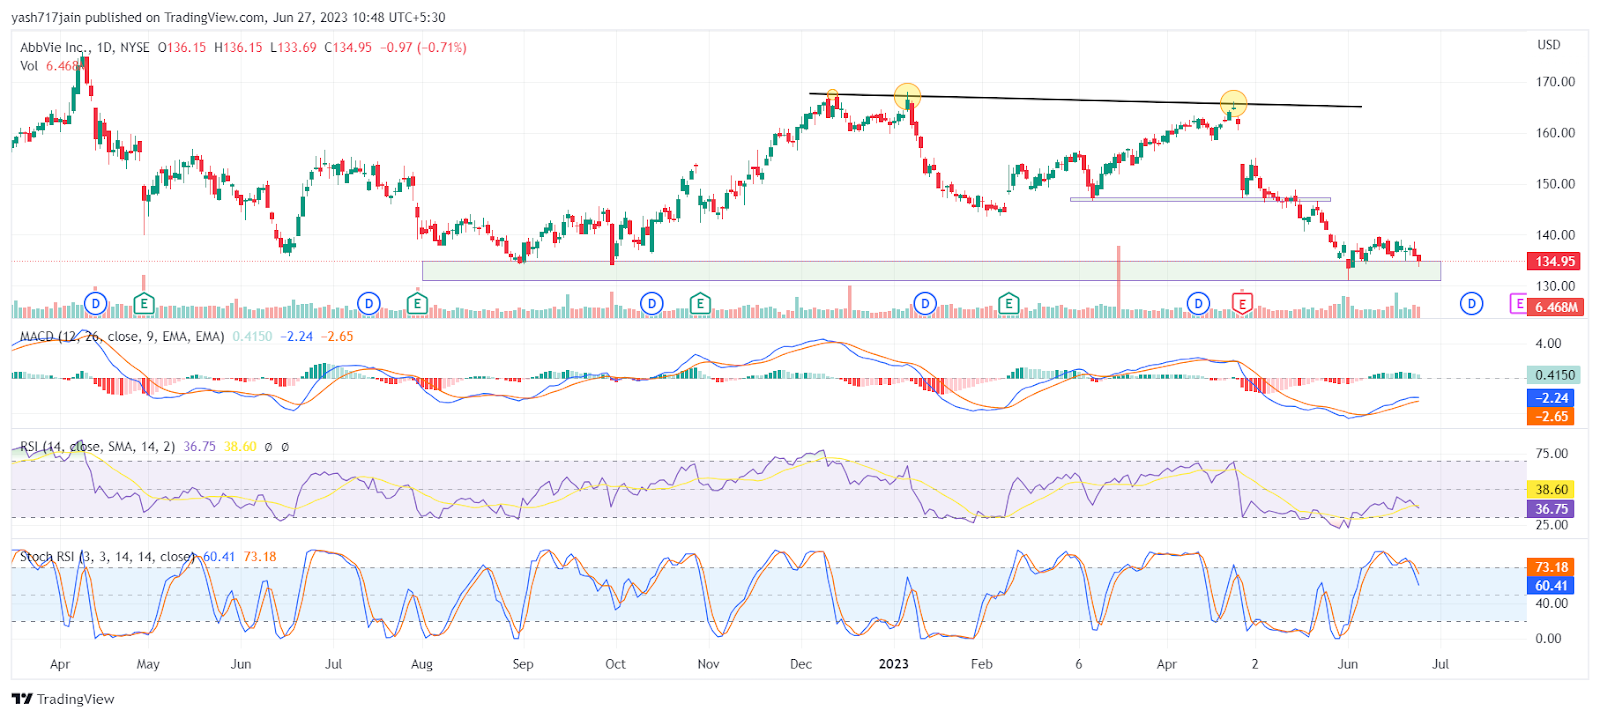
- The price of ABBV is trading at $134.95.
- The ABBV price decreased by 0.71% in the last 24 hours.
- The ABBV year-to-date return is -16.72%.
Trend Analyzation
This week the trend was bearish as the price was down by 1.28%. By trend and price information history, we can say that ABBV Stock is not performing well right now.
Fundamental Stats
- The ABBV stock market capitalization is $238.09 billion.
- The ABBV stock price-to-earning ratio is 32.01.
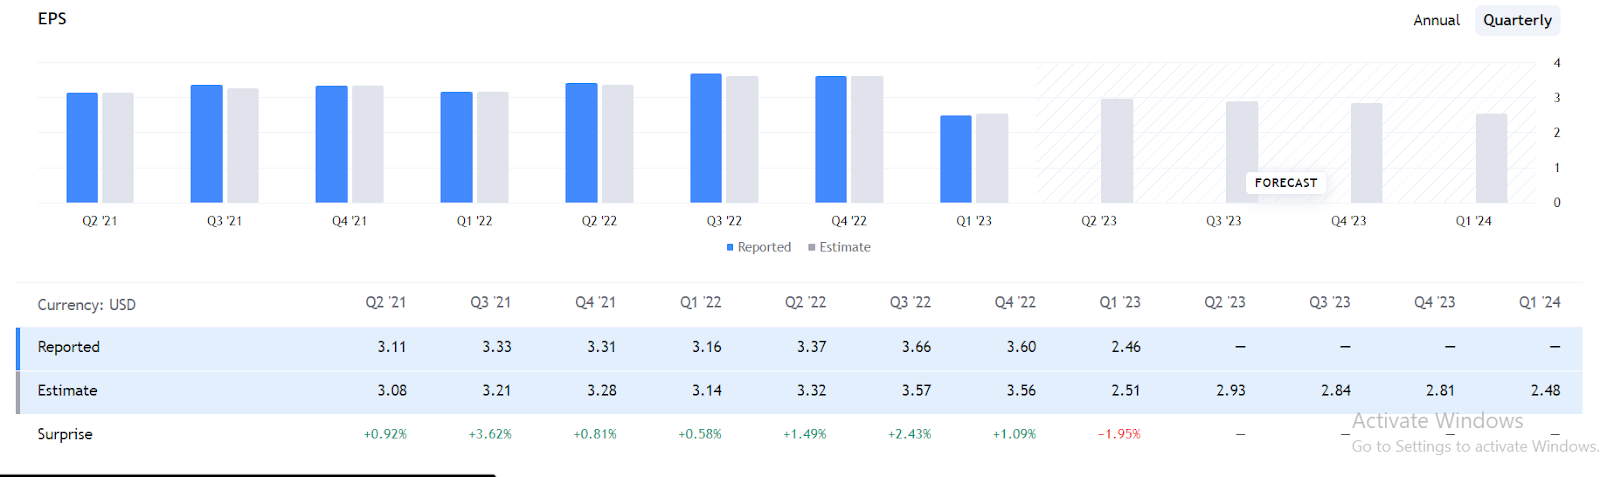
- The ABBV stock’s basic EPS is $4.26.
- The ABBV stock’s profitability net margin is 1.87%.
- The ABBV stock’s revenue is $58.05 Billion.
Source: ABBV.1D.NYSE by TradingView
In 1-D Timeframe
Source: ABBV.1D.NYSE by TradingView
Stochastic RSI
The K-line measures the current closing price relative to the high and low prices of the given period. The D-line is a moving average of the K-line and indicates whether the security is overbought or oversold. Therefore, we can observe that both lines are currently headed towards an oversold zone indicating a more downward movement scenario.
RSI
As we can see in the chart, the RSI line is in a bearish zone i.e., the line trading below the median line. Since the 14 SMA line and RSI line are below the median zone, the market is bearish. The daily time frame chart suggests that ABBV stock is currently headed toward an oversold zone and will fall soon.
MACD
Not long ago, the MACD line crossed below zero line, giving a bearish signal indicating downward momentum and decreased price. From the last bearish crossover, it’s still in a downtrend. This is because the MACD line is a momentum indicator that is calculated by subtracting the 26-day exponential moving average (EMA) from the 12-day EMA.
When the MACD line crosses below the zero line, it is an indication that the short-term EMA is lower than the long-term EMA, and it is seen as a bearish signal. This suggests that the current momentum is negative and the price may decrease. Therefore, we can say that a bullish crossover below the zero line is not traded until it crosses and reaches above the zero line. Since it is happening below the zero line, it cannot turn bullish. The trend is bearish currently.
Source: ABBV.1D.NYSE by TradingView
EMA
The price is going down on the 1D chart. It is below the 50 & 200 EMA (exponential moving average), which is supporting the trend downwards.
Investors’ sentiments regarding ABBV stock are negative and are on the bearish side. Also, the price stayed below 20 EMA which gives quite an idea that sellers are ready to sell stock at every price. The price has to go up and sustain above all the EMA’s in order to change the direction. The sellers are stronger than the buyers which highlights a sell signal.
Bollinger Band
In the Bollinger Band indicator, the ABBV stock price is trading at the lower band. After taking rejection from the 20-day Simple Moving Average (SMA) of the Bollinger Bands, it is indicating a downward move.
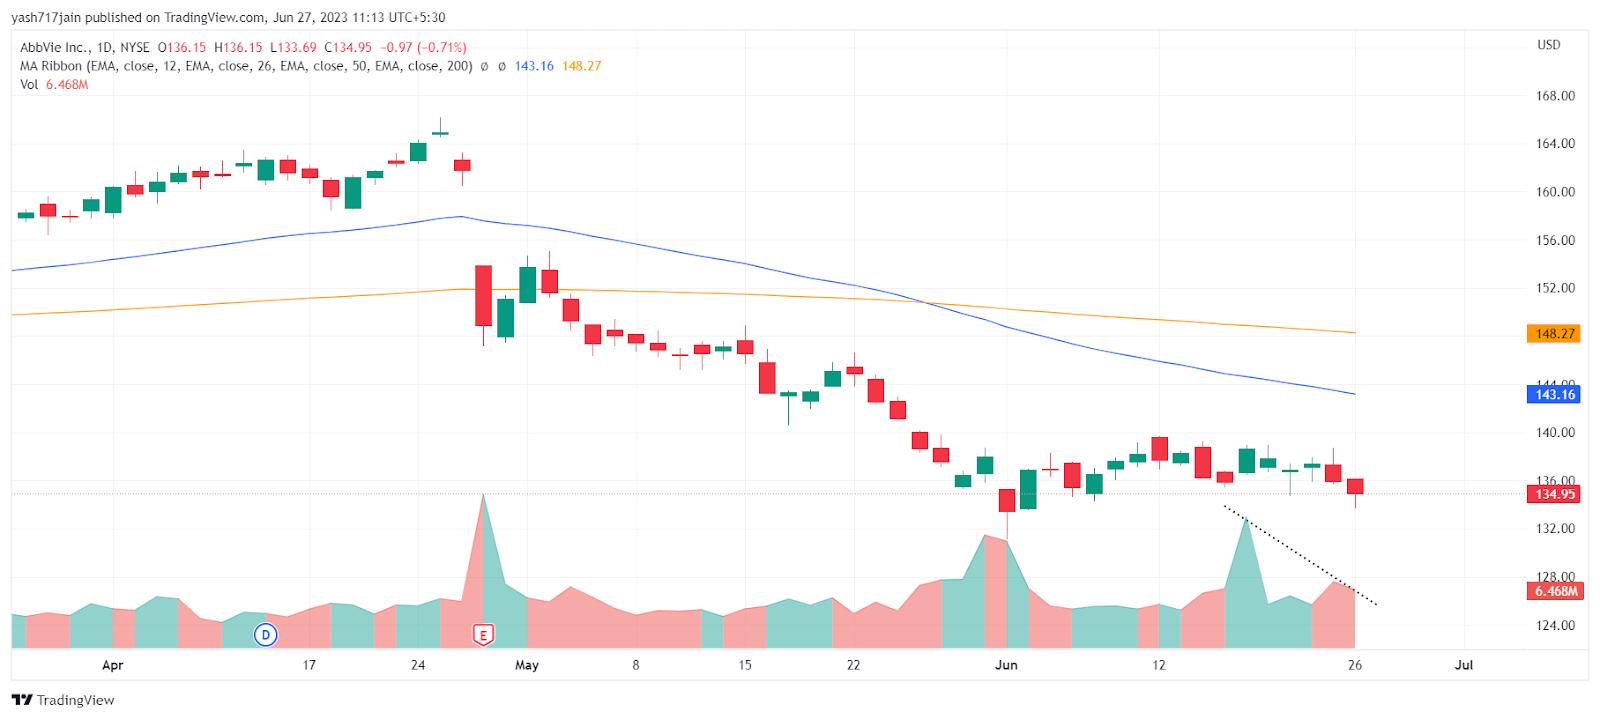
Source: ABBV.1D.NYSE by TradingView
Volume Analyzation
The amount of ABBV traded in a day is $6.46 Million. As observed from the volume graph, the trading activity is decreasing in the stock. Therefore, it can push the price downwards as the sentiments are negative.
Conclusion
Currently, the technical parameters for the ABBV stock indicate bearish pressure. The views of traders and investors are bearish. If the price continues to move under the seller’s control, it is expected to fall more from the current levels. The sentiments of investors and traders are bearish regarding the price of Abbvie Incorporated (AABV) in the 1D timeframe.
Technical Levels:
- The Nearest Support level is $122.97.
- The Nearest Resistance level is $162.51.
Disclaimer
In this article, the views and opinions stated by the author, or any people named are for informational purposes only, and they don’t establish the investment, financial, or any other advice. Trading or investing in cryptocurrency assets comes with a risk of financial loss.