
 Injective
 Celestia
 streamoors
 Sui
Sui Pudgy Penguins
 Bitcoin
 Pearl
Pearl
- Raytheon Technologies Corp.’s stock price is trading above 50-day and 100-day EMA levels.
- Raytheon Technologies Corp.’s stock price is currently trading at $98.03.
- Raytheon Technologies Corp. (RTX)’s live market cap is $142.09 Billion.
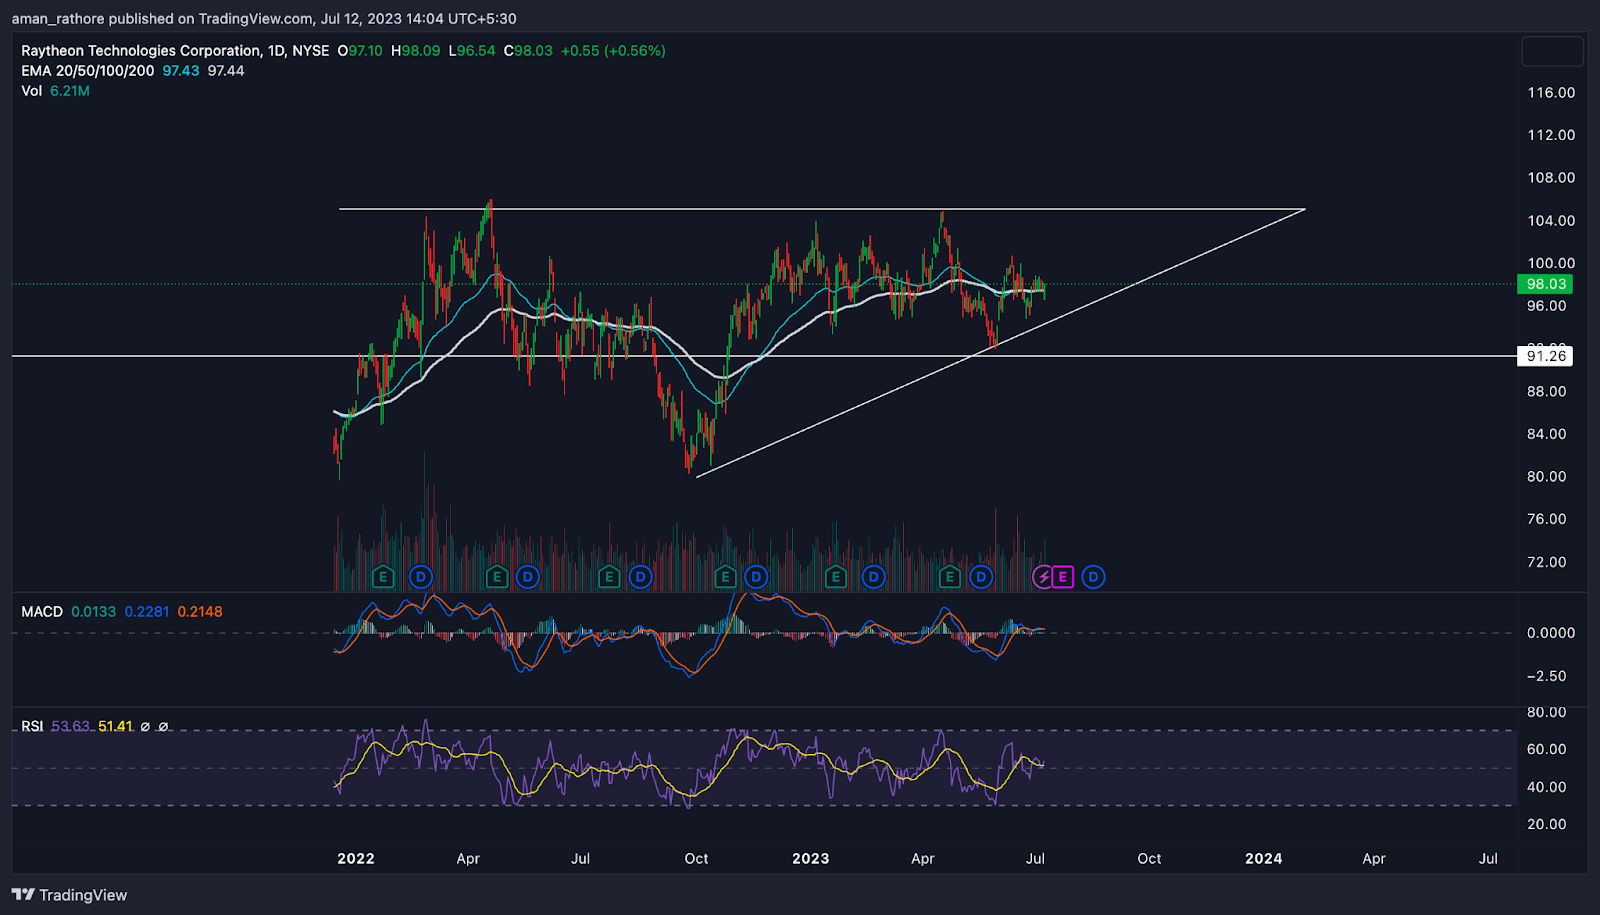
As per the chart analysis of Raytheon Technologies Corp. stock price in the weekly timeframe, the price is currently in an uptrend momentum. The price has been consistently rising for a very long time period, it has once faced a pullback of -56% in just five weeks. After some time, the price reversed and formed a high of $106.03.
Currently, the price is moving in a range of $105-$91 levels and it has formed a triangle pattern. By looking at the overall structure we can determine that the price of Raytheon (RTX) is gaining some strength and highly likely if the price breaks above the resistance level it will further rise. If the price failed to break the above level, it might continue consolidating in this range.
The dividend yield ratio of RTX is 58% and its current dividend yield is 2.4%. For the year 2023, the RTX stock is going to announce it’s divided on 7th September 2023. This might attract the buyer’s attention.
The price-to-earning (P/E) ratio of Raytheon Tech Corp. (RTX) is 25.8x which is less than the peer-to-peer average p/e. This indicates that the share price of RTX is at the right value.
Raytheon Technologies Corp. (RTX) Stock Price Analysis
EMA
RTX is trading above 20, 50, and 200-Day EMAs on a daily basis. This is a strong signal that the stock price of RTX is on the rise. Buy-side investor confidence is expected to improve in the coming days.
MACD
RTX’s MACD line has moved above the signal line on a daily basis, indicating a bullish signal. Red histograms indicate an increase in bearish momentum, indicating that the price of Raytheon Technologies Corp.‘s price is likely to increase further in the near future.
RSI
Raytheon Technologies Corp.’s Relative Strength Index (RSI) is at 67.89, and its 14-day SMA line is about 53.89 lower than the median. That’s a sign that the market is having a good momentum, and the RSI isn’t in oversold territory, which means the stock is getting some traction.
Volume Analysis
As can be seen in the charts above, the volume of the stock of Raytheon Technologies Corp. is steadily increasing over time, which is a bullish and hopeful sign for the price movement of the stock. The increasing volume of the stock indicates that there is more market participation and possibly more investor interest in shares of Raytheon Technologies Corporation.
Conclusion
Raytheon Technologies Corp. has a strong market structure and a growing momentum, according to the report. This upbeat attitude is supported by indicators like MACD, RSI, and EMA, which suggests that the price of Raytheon Technologies Corp. stock price may increase in the future.
Technical Levels:
- Support Level is $91.26.
- Resistance Level is $105.
Disclaimer
The views and opinions of the author, or anyone named in this article, are for informational purposes only. They do not offer financial, investment, or other advice. Investing or trading crypto assets involves the risk of financial loss.



