
 Quack AI
 Pudgy Penguins
 Injective
 Solana
 NEAR Protocol
 Canton
 Zcash
Zcash
- Nike Inc. stock price has placed below the 20, 50, and 200- days Exponential Moving Average.
- Nike Inc.’s stock price is currently trading at $107.39.
- Nike Inc. (NKE)’s live market cap is $165.1 Billion.
As per the analysis currently, the stock price of Nike Inc (NKE) is in a downtrend momentum forming lower lows. In November 2021, the price of Nike Inc made a high of $179.1, and after that, the price fell by 54% in the next year.
The price took support at the $82 level and started moving upward. Further, the price moved up to $131 and it faced resistance there. The price tried to break the resistance multiple times but it failed and after consolidating for around three months, the price again started falling.
As per the current market scenario, the price of Nike Inc (NKE) stock is forming a weak market structure indicating a fall soon. Also, the volume of the stock seems to be declining which might lead to a fall in the future.
As per the fundamentals of Nike Inc., the P/E ratio is 32.6x which is more than the US market luxury average as per the data mentioned in simply wall street. This indicates in the future Nike’s price might fall.
Nike Inc. (NKE) Stock Price Analysis
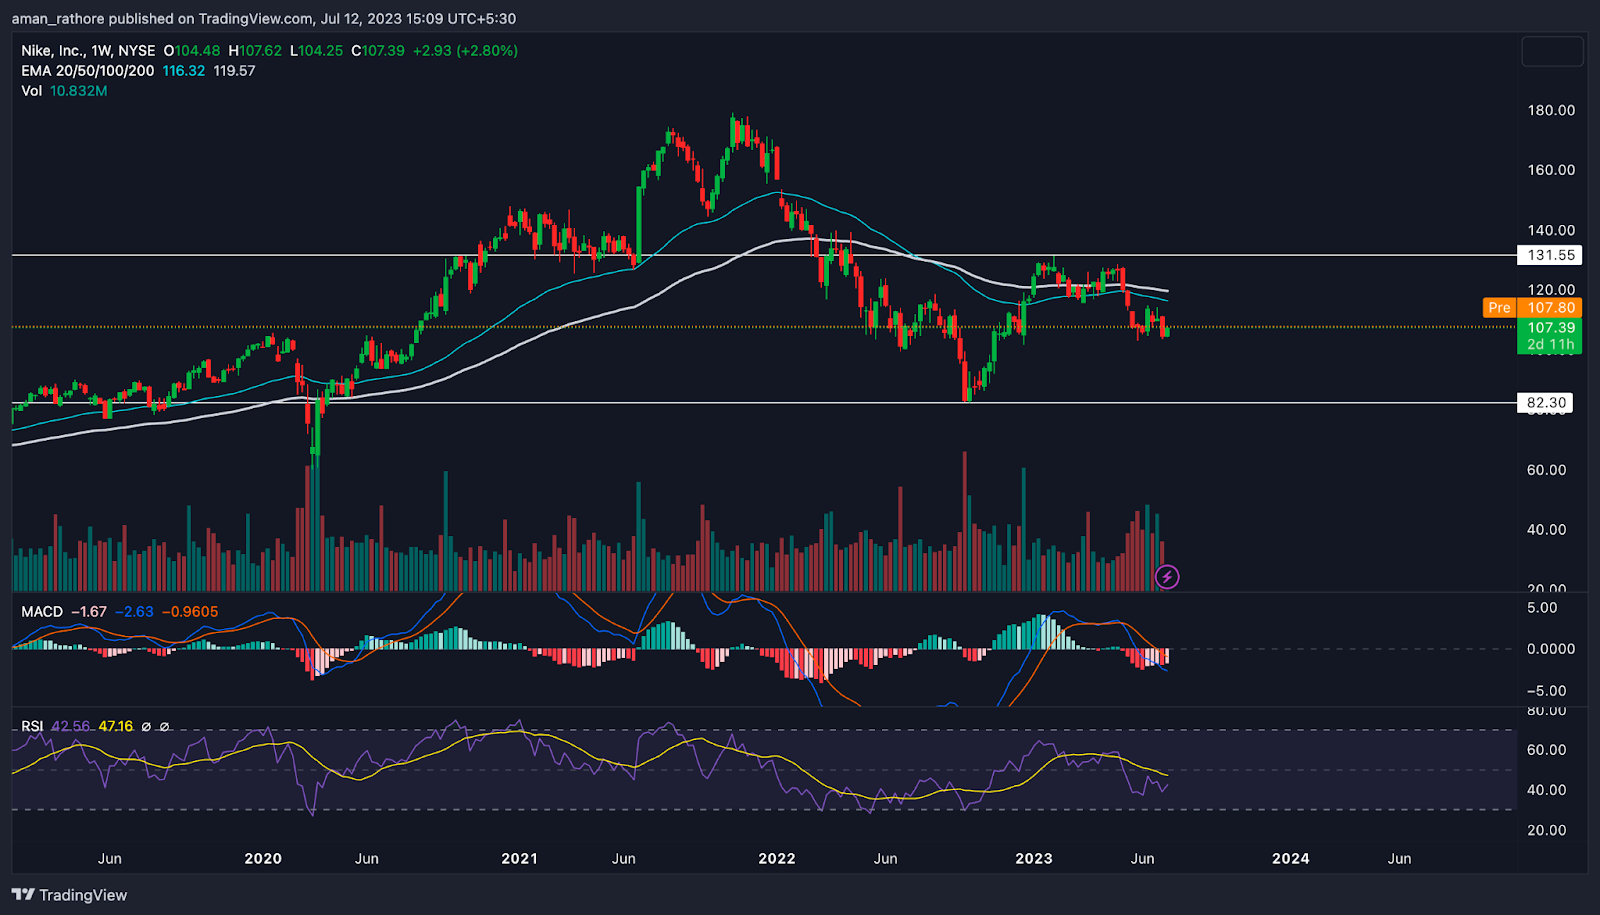
The 20, 50, and 100-day Exponential Moving Averages (EMA) for Nike Inc.’s shares are all below the price, which is a positive sign and can be a sign that the company is about to decline in value.
The MACD line and the signal line, which are both situated below the zero line, produce the red histogram that is the MACD indicator. This configuration suggests a possible market downfall.
The fact that Nike Inc.’s Relative Strength Index (RSI) has not entered the oversold region is proof that there may still be room for prices to decline shortly.
As observed in the chart, the volume of Nike Inc. (NKE) is also observed to be declining indicating a further drop in market price in the future.
Conclusion
In conclusion, the stock price of Nike Inc. is currently showing unfavorable indicators, and further price declines are expected in the near future. There is a significant indicator of a downward movement for the price of Nike Inc.’s stock. When these factors are considered, such as the unfavorable EMA placement, the bearish MACD configuration, and the absence of oversold conditions in the RSI.
Technical Levels:
- Support – The current support level of Nike Inc. (NKE) is $83.
- Resistance -The current resistance level of Nike Inc. (NKE) is $131.
Disclaimer
The views and opinions of the author, or anyone named in this article, are for informational purposes only. They do not offer financial, investment, or other advice. Investing or trading crypto assets involves the risk of financial loss




