
 Dacity Coin
 streamoors
 Celestia
 Injective
 Quantus
 Pudgy Penguins
 Pearl
Pearl
- The Graph (GRT) is currently trading at $0.1 with a decline of +3.60% in the last 24 hours.
- The Graph (GRT)’s live market cap is $1,308,884,226.
- The Graph (GRT)’s 24-hour volume is $30,105,419 with an increase of 63% in the last 24 hours.
The Graph (GRT) is the original cryptocurrency of The Graph protocol. The Graph protocol is a decentralized network designed to revolutionize the data availability on blockchains by providing a decentralized indexing and query system. The Graph protocol allows developers to access and retrieve blockchain data efficiently through open APIs known as subgraphs, which provide a way to structure and display specific data from different blockchains. Subgraphs make it simpler for developers to create decentralized applications (dApp) based on accurate and real-time information.
Trend Analysis
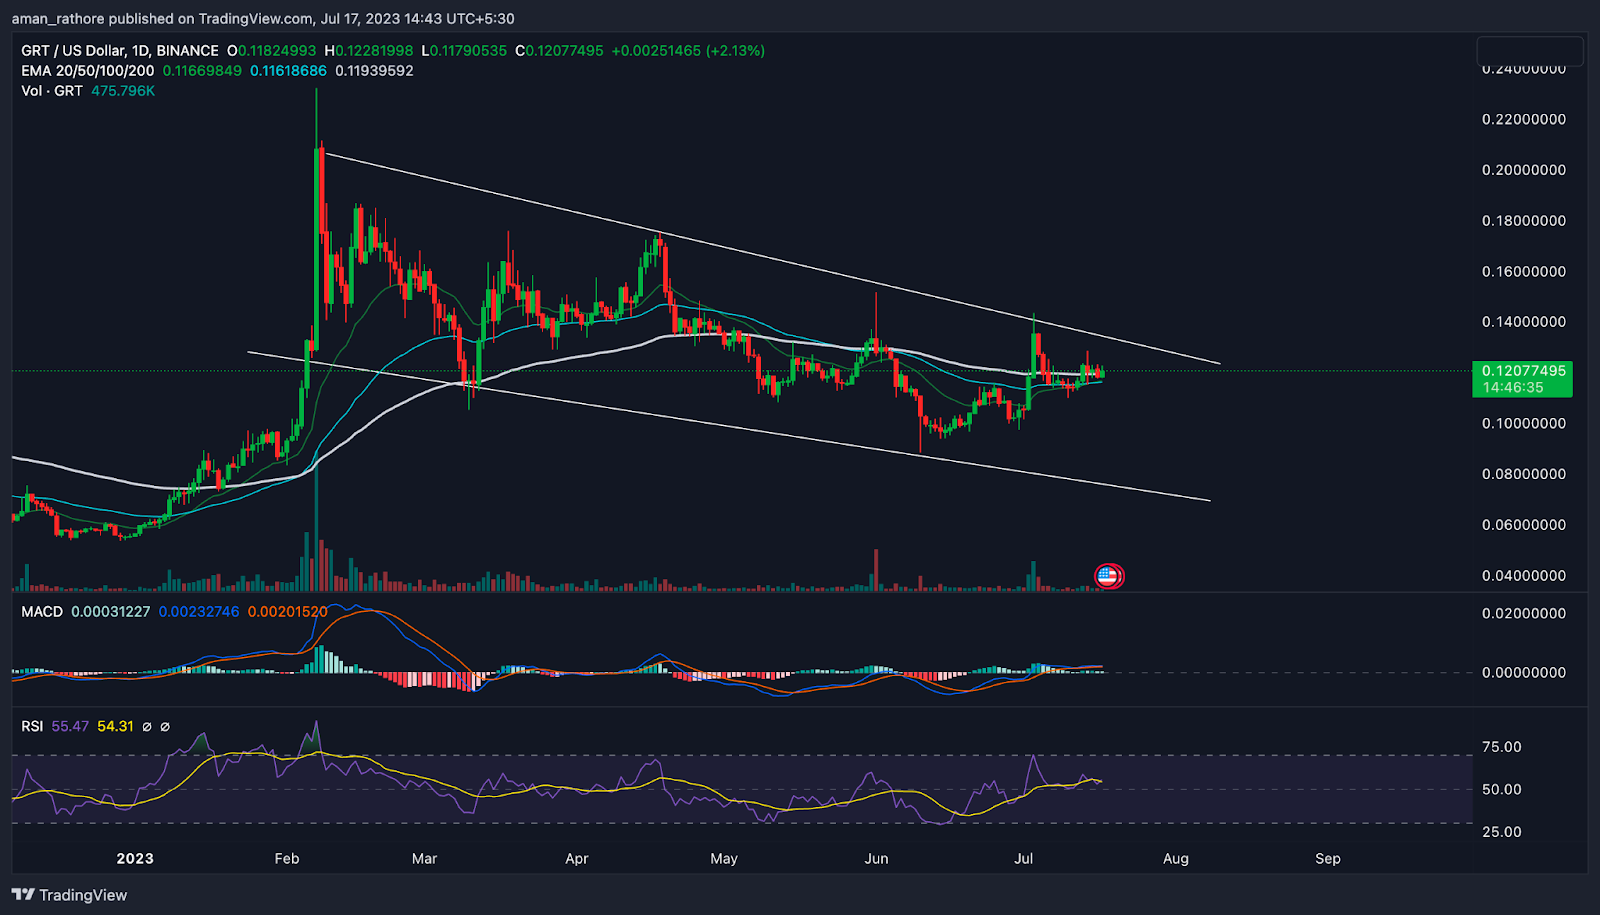
The Graph daily time scale study shows that the price is trending downwards. After reaching a peak at $0.232 in February 2023, it entered a bearish trend with a 61% decline. However, the price has recently started to recover and is currently trading around $0.122 which is 39% higher than last month.
The price of GRT has formed a parallel channel pattern which suggests a consolidation phase. It is now close to a resistance level. From the overall structure of GRT, it looks like it has a bullish outlook. This resistance level will likely be breached which could lead to further upward movement in the near future.
The Graph (GRT) Price Analysis
EMA
GRT crosses 20-day , 50-day , and 100-day MACD on a daily basis, indicating a bullish trend. The price of graph has an upward momentum and the uptrend is likely to continue.
MACD
The Graph’s MACD line is above the signal line. This indicates a bullish rise. The green histogram bar also supports a bull run. Therefore, The Graph’s price is likely to rise further in the near future.
RSI
The relative Strength Index (RSI) for GRT is now circling around the 55 level. Also, the RSI line is above the SMA line. This implies a positive market attitude.
Volume Analysis
Looking at GRT’s daily chart, we can see that the coin’s volume is increasing. This can be seen by the growth of large green candles, which indicate more market buying activity. The growing volume indicates that buyers interest is growing, which can be interpreted as a bullish outlook for GRT.
Conclusion
As per the analysis the conclusion is that the price movement of GRT is indicative of a strong upward movement, which is supported by the formation of a bullish pattern. Furthermore, indicators such as the MACD and the EMA also confirm the bullishness of GRT, indicating that the cryptocurrency has a positive outlook in the near future.
Technical Levels
- Support – The current support level of The Graph (GRT) is $0.0871
- Resistance -The current resistance level of the Graph (GRT) is $0.138.
Disclaimer
The views and opinions expressed by the author, as well as those of anybody else mentioned in this piece, are only for informational purposes. They do not provide any financial, investing, or other advice. When buying or trading cryptocurrencies, there is a risk of financial loss.




