
 Quack AI
 Pearl
Pearl Solana
 NEAR Protocol
 Canton
 XRP
XRP Derive
- XOM stock price surged 1.7% in the last trading session and is currently trading at $109.56.
- Exxon Mobil’s share (NYSE: XOM) has 3.99 Billion free float shares, almost 99.8% of the total shares indicating high liquidity in the stock.
Xom stock price formed a down-broadening wedge with the buyers getting aggressive after every dip. The price was very volatile on the charts for the past 3 months. Recently the stock’s pre-results sentiments were negative leading to a fall of 6% but the post-results sentiments were totally different. The bulls surged the price 8% up closing at the edge of a breakout.
Exxon Mobil (NYSE: XOM) is a global leader in oil, gas, and petroleum products. It has three main segments: Upstream, which explores and produces energy resources; Downstream, which refines and sells fuels and lubricants; and Chemical, which makes and markets petrochemicals.
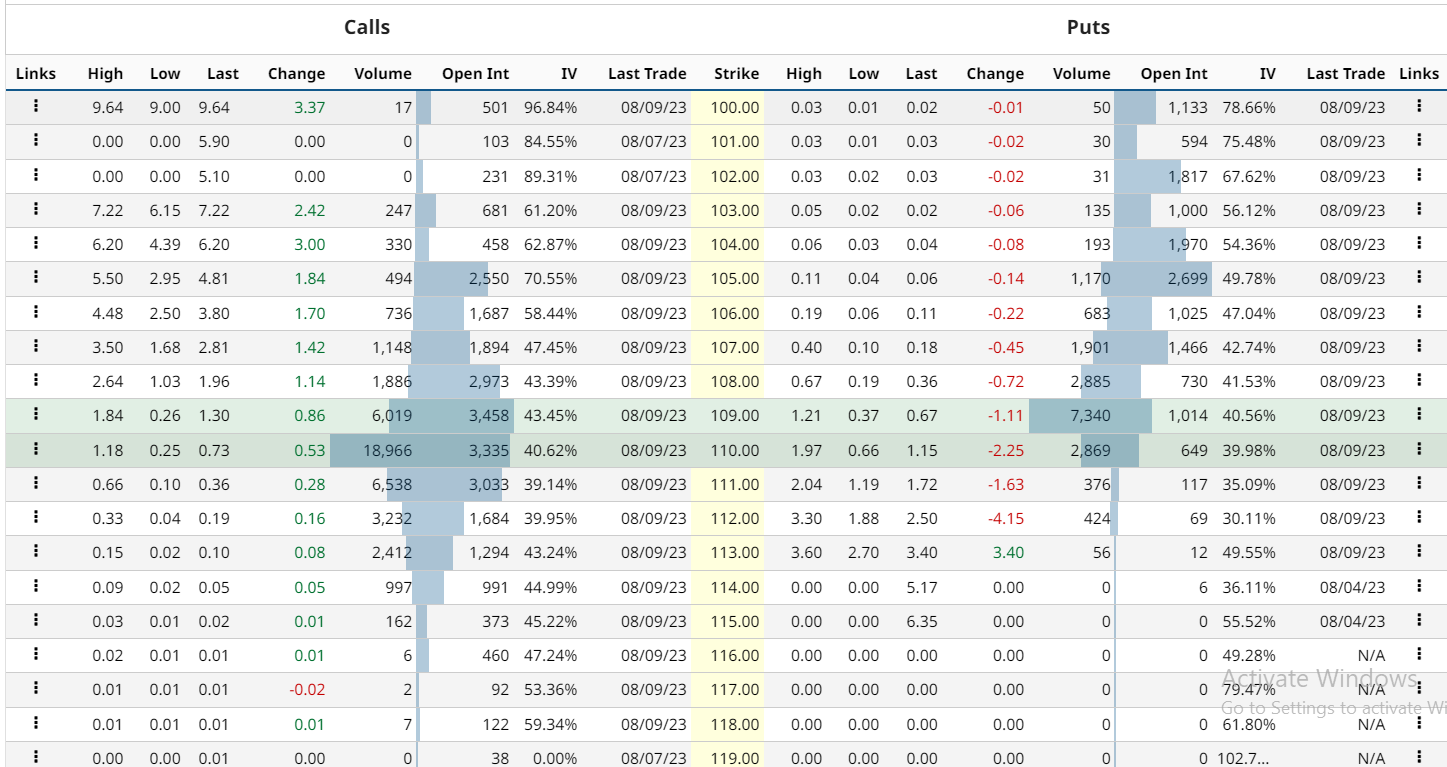
XOM stock option-chain analysis states that the current implied volatility in the market is 23.19% with an increment of 0.52% in the last trading session. The at-the-money strike price has 1,014 open contracts on the put side and 3,458 open contracts on the call side indicating the presence of sellers at the current level. The PUT/CALL ratio is 0.85 indicating a bearish sentiment in the market as per the data.
XOM Stock Price Action Analysis
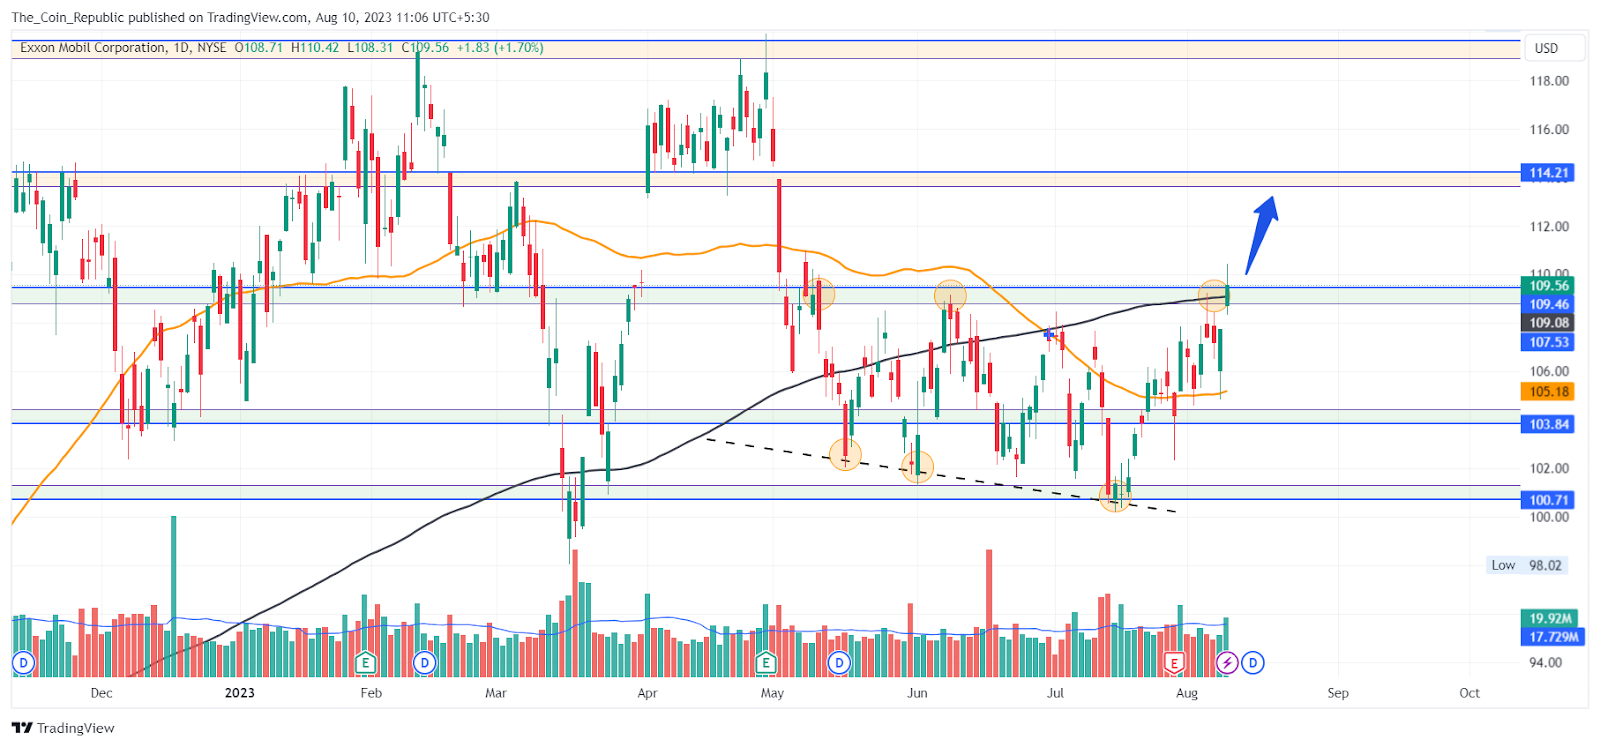
Currently, XOM stock price is trading at 109.56 and has made a closing near the upper resistance of descending broadening wedge formed in the last trading session.
The short-term outlook for the stock is positive as the price may surge to the upper supply levels if succeeds in sustaining at the current levels. The bulls are aggressive since the disclosure of the quarterly results.
The long-term outlook of the price trend is optimistic as the price is successful in closing above the 200 EMA. Also, the past price action analysis shows bullishness in the long-term trend.
Technical Indicators prediction about the current trend
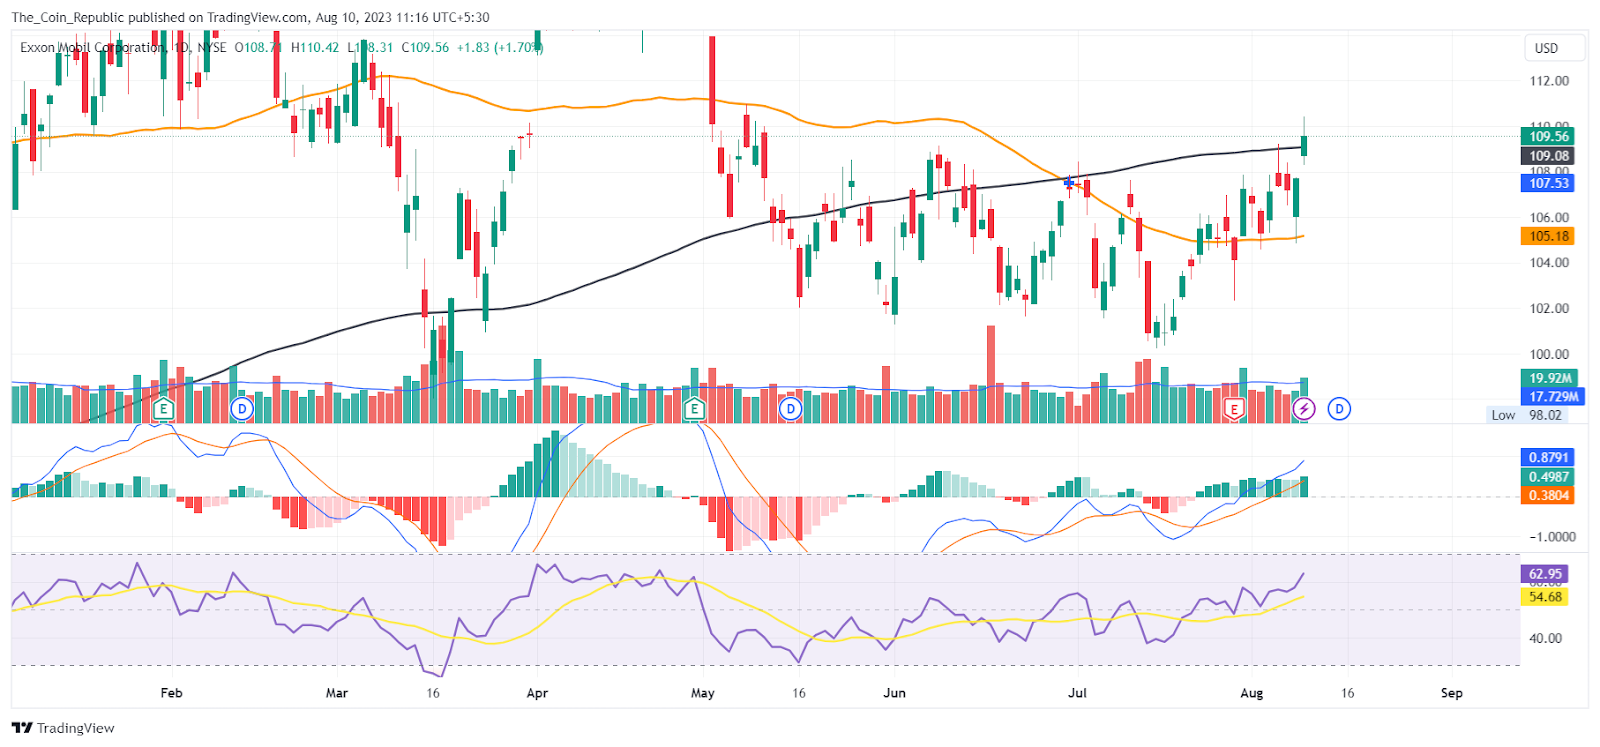
At the time of publishing, the RSI value of the XOM share price is 41.20 and that of the SMA line is 44.16. RSI has broken the SMA line indicating bullishness in the short term and the current trend may continue.
On the daily XOM Chart, the stock took support from the 50 EMA and made a bullish move signifying the presence of buyers in the market.
Conclusion
XOM stock price prediction concludes that XOM stock price is bullish in both short-term and long-term trends. It is near the upper resistance of a descending broadening wedge and may break out soon. It is also above the 200 EMA, indicating a strong uptrend. The quarterly results have boosted the confidence of the buyers. The Technical indicators are also leaving a positive note about the current price trend which may be an additional confirmation for the buyers.
Technical Levels
- Support levels: $103.84 and $100.71.
- Resistance levels: $109.56 and $114.21.
Disclaimer
The views and opinions stated by the author, or any people named in this article, are for informational purposes only and do not establish financial, investment, or other advice. Investing in or trading crypto or stock comes with a risk of financial loss.




