
 Celestia
 LayerZero
 Sui
Sui Injective
 Pi Network
 Quantus
 Pudgy Penguins
- Admiral Group stock price is trading at £2150 while witnessing a gain of 0.02% during the intraday session.
- The year-to-date return of ADM stock price is 0.56% and the three-month return is -0.92%
Admiral Group PLC is a British financial services company based in Cardiff, Wales. The company is primarily engaged in the sale and underwriting of private car insurance, along with operating in the price comparison sector. It serves these segments through well-known platforms such as Confused.com in the UK, Rastreator in Spain, LeLynx in France, and compare.com in the United States.
H1-2023 Report Impacted The Trend
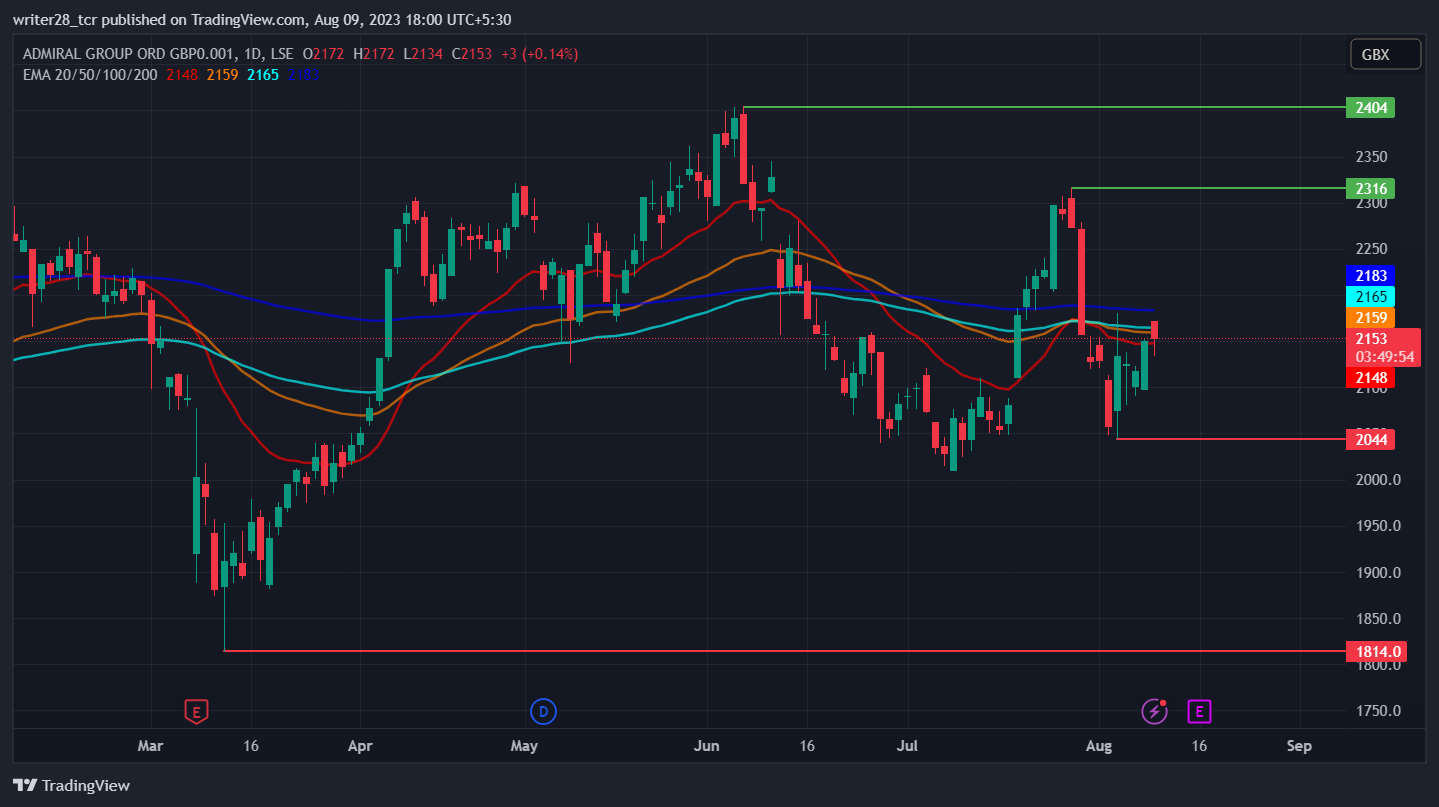
Since its H1 earnings report on March 8, 2023, ADM stock has experienced a significant uptick in price, indicating a strong bullish trend. This surge helped the ADM stock reach an annual high of £2404 on June 7. However, the price encountered resistance at this level.
Despite this positive price movement, the H1 earnings report revealed a negative aspect, as the EPS (earnings per share) for the period was -£1.47. This result was in contrast to the reported EPS of £57.13 and the estimated forecast of £58.60.
On the revenue front, the H1 report showed promising results, with reported revenue totaling £183.36 billion. This figure exceeded the estimated revenue forecast of £176.15 billion by £7.20 billion.
The Current Development In Admiral Group Stock
Mike Rogers has been appointed as a new non-executive director and chair.
The monthly and weekly return of 7.06% and 2.09%, respectively, reveal the bullish momentum in the market. Thus, there is a possibility that Admiral stock price might move in an upward trajectory soon. If the current candle can break the high of the August 3 candle, then there is a possibility that the price might reach the July 27 candle’s high, which is £2316.
However, if the current candle breaks the previous candle’s low, then the price might retrace toward the recent support level of £2044.
Technical Analysis Of Admiral Group Stock
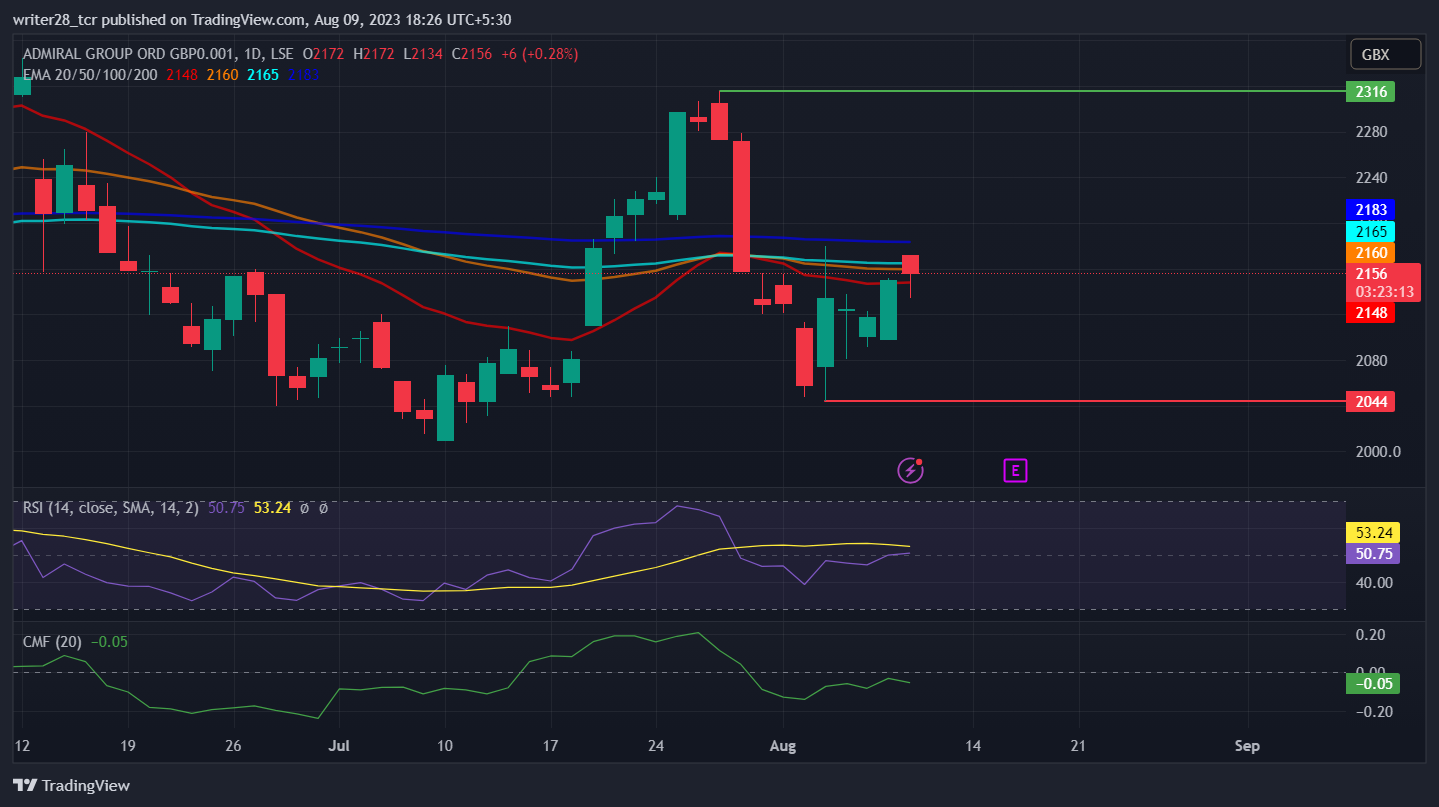
The relative strength index (RSI) trades at 40.75 during the intraday session. RSI denotes a rise in bullish momentum in the market as ADM stock price is gaining daily.
The chaikin money flow (CMF) score is -0.05 during the intraday session, indicating slight weakness with a stronghold of bears in the market.
The Admiral stock price is currently trading above the 20, 50, and 100-day EMAs, indicating increased participation of sellers in the market.
Conclusion
The market structure indicates the impulsive move by ADM stock while overcoming a previous pullback. The monthly and weekly returns also indicate the bullish trend in the market. Investors should look for buying opportunities as the indicators reflect the same.
Technical Levels
Major resistance: £2316 and £2404
Major support: £2044 and £1814
Disclaimer
The views and opinions stated by the author, or any people named in this article, are for informational purposes only. They do not establish financial, investment, or other advice. Investing in or trading crypto assets comes with a risk of financial loss.




