
 Pearl
Pearl Ondo
Ondo Starknet
 Quantus
 Aerodrome Finance
 Pudgy Penguins
 Akash Network
- Direct Line’s stock price is currently trading at $151.10.
- Direct Line’s stock price is currently inside an ascending Triangle pattern.
Will Direct Line go through the consolidation phase?
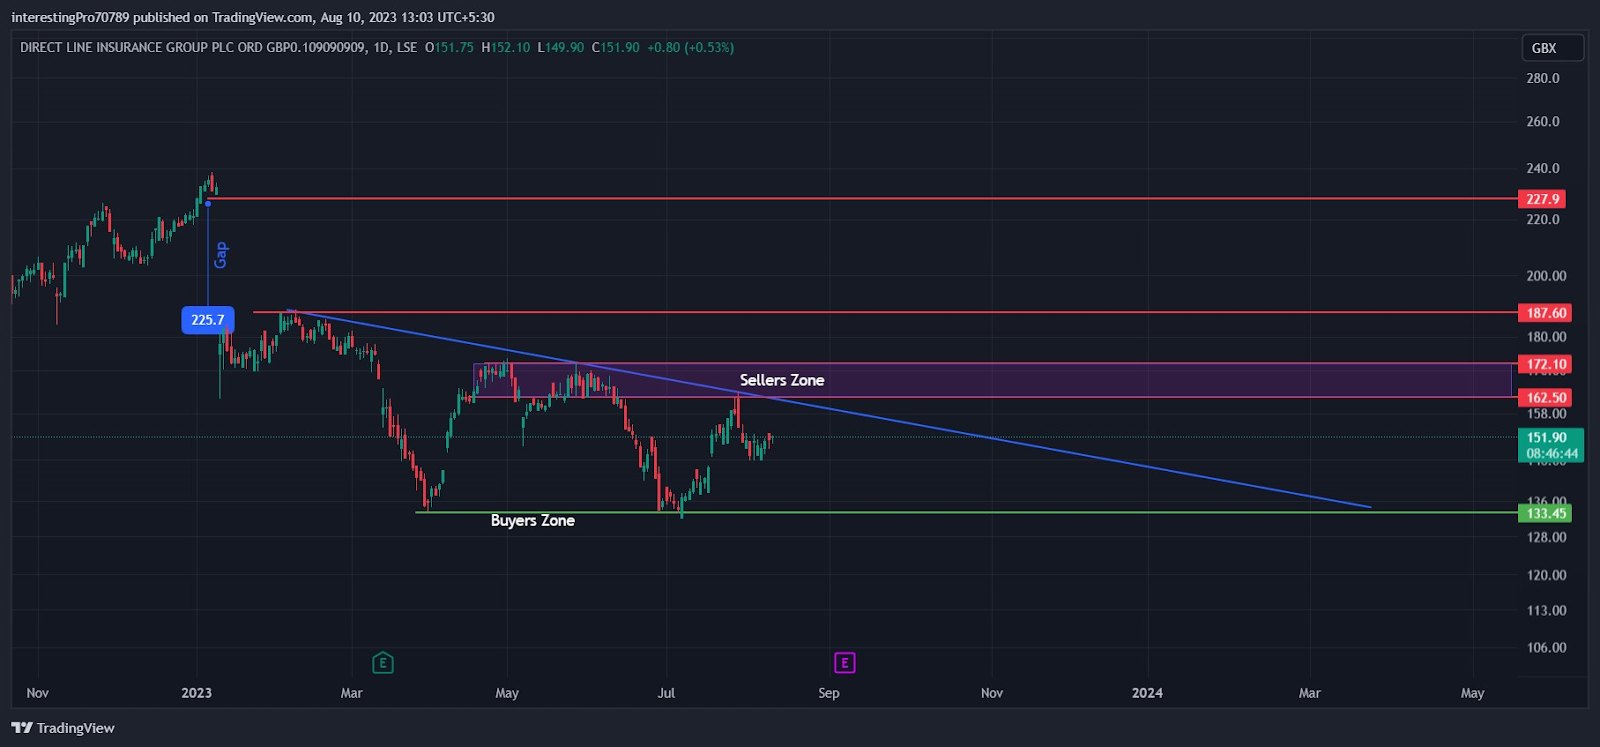
In February 2023, the Direct Line stock price fell by about 30%. And then the stock formed the $133.45 support level and showed a bullish rally to the $172.10 level, and the price of the direct line started facing rejection from there. The price two times to close above the $172.10 resistance, but it eventually face rejection from there and formed a double-top pattern, which is also consider a bearish pattern.
After the fall price was again seen at the $133.45 support level, buyers push the price in the upward direction and made the support level of $133.45 a very strong level for buyers, but the price face reject at the $162.60 level.
The price is trading in a Descending Triangle like pattern where the Sellers are shifting from a higher level to a lower level, forming a Higher Low structure and showing their dominance in the current scenario, whereas the Buyers are showing their strong presence at the support level of $133.45. We can see that there is a gap left in the market that needs to be fill because every time there is a gap, the price always tries to fill the gaps left.
So if the price gives a breakout of the zone from $162.50 to $172.10, a bullish momentum can be seen until the $187.60 resistance, and if the price breaks and also manages to give a breakout of $187.60, then the price can fill the gap that is left in the chart of the direct line and the price can reach the $227.9 level. And if the price faces rejection or stays below the zone of $162.50 to $172.10, then the price can consolidate in a wide range from $162.50 to $133.45 support.
Technical Indicators prediction about the current trend
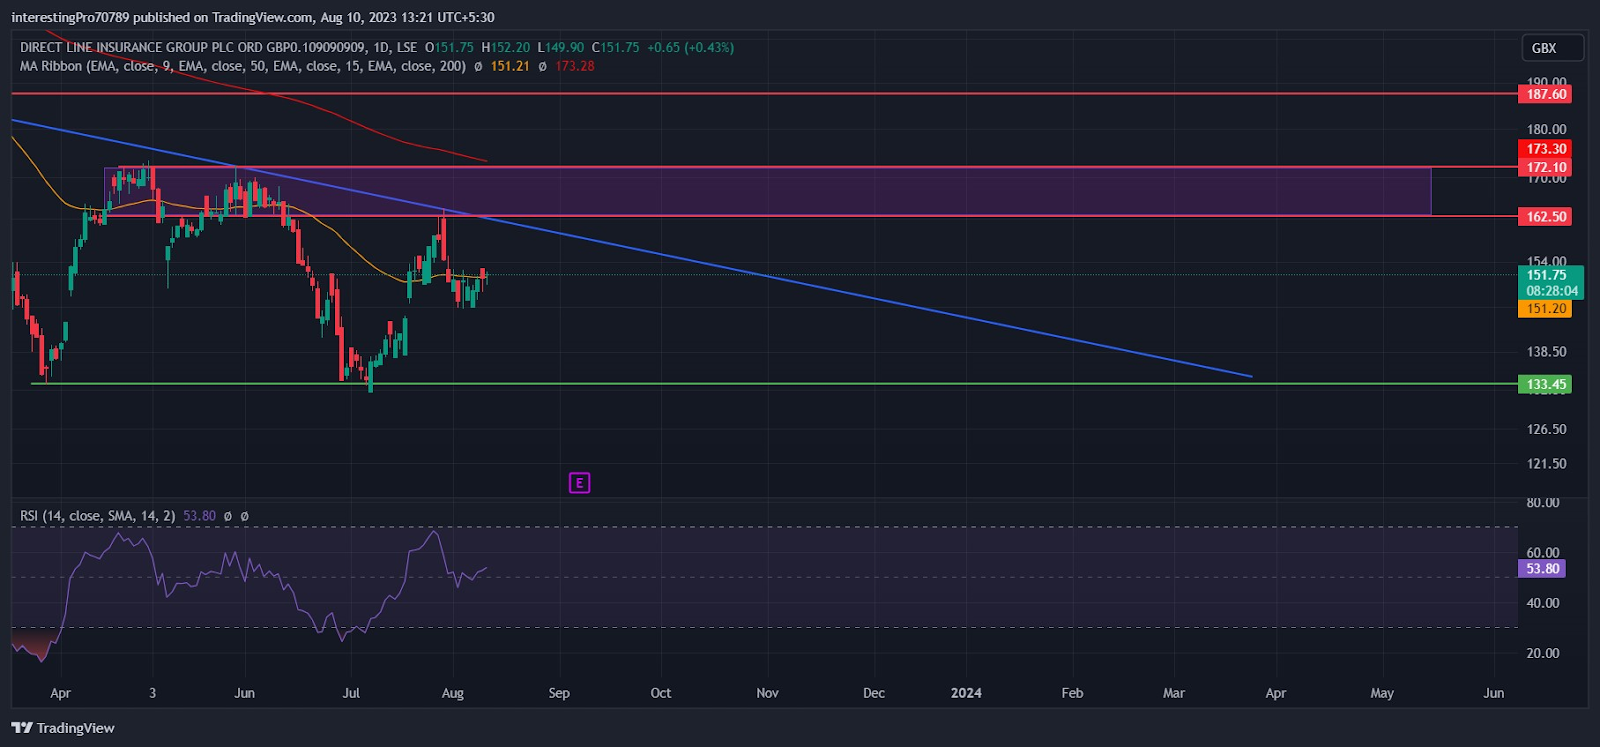
The Relative Strength Index (RSI) is at 53.80, and the RSI line is trending in the upward direction after taking support from the 50 RSI level. The RSI is currently in neutral territory, which shows the price is under pressure from buyers and sellers.
Conclusion
The Chart of the Line is currently bearish as the sellers are showing their dominance in the current scenario, but the buyers are also showing their strong presence at the support level of $133.45. If the price breaks the zone of $162.50 to $172.10, then it can reach the $187.60 resistance, and if it also manages to give the breakout the $187.60 resistance level, then the price can fill the gap that is left. And if the price faces rejection or stays below $162.50, then the price can again be seen at $133.45. The previous two earnings reports were positive, and the current earnings report is also expect to be positive, which means a huge move in price is expect.
Technical levels
Resistance levels: $162.50, $172.10, and $187.60
Support levels: $133.45
Disclaimer
The views and opinions stated by the author, or any other person named in this article, are for informational purposes only. They do not provide financial, investment, or other advice. Investing in or trading crypto assets comes with a risk of financial loss.




