
 Minter
 Quack AI
 Starknet
 NEAR Protocol
 Sui
Sui Hyperliquid
 Bittensor
- PHNX stock price is currently trading at 507.2 GBX.
- The company stock is in a continuous downtrend and forming a higher low structure.
The Phoenix Group Plc (LSE: PHNX) was founded in 1782. The company operates as a life and pension consultant. The company is specialized in the acquisition and management of closed life insurance and pension funds.
Phoenix Group Plc (PHNX) Stock: Financial Analysis
The Phoenix company’s revenue report has been pretty impressive for the last three years with an overall growth of 0.50%.
The PHNX company has estimated to have 6.80 Billion GBP in the 2023 revenue report. The company surpassed the estimated revenue value in the 2020 and 2021 revenue reports. In 2022 the company did not surpass the estimated value but was able to close near the estimated revenue.
Phoenix Group Plc (PHNX) Stock: Technical Analysis
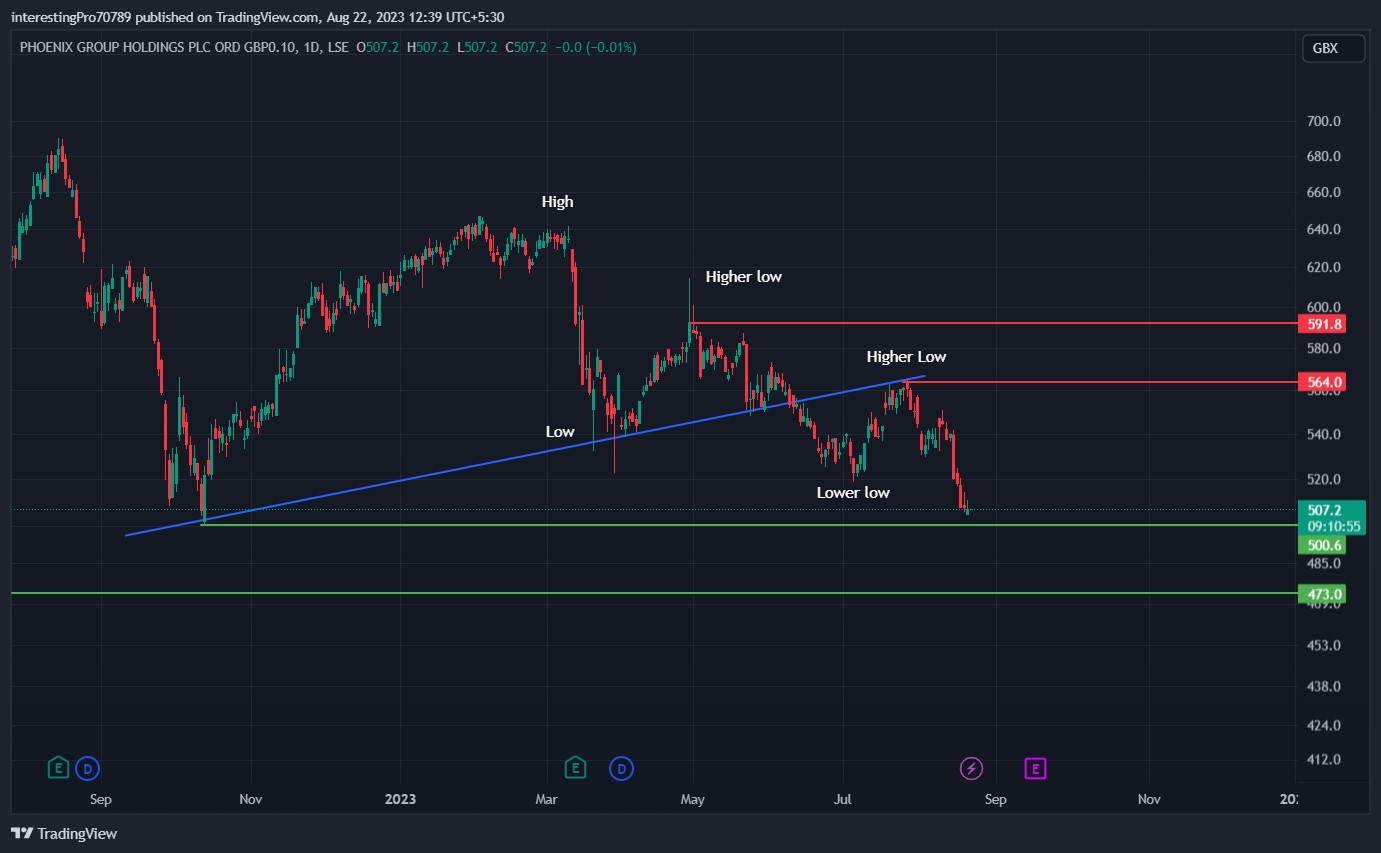
In October 2022, the PHNX Stock price formed a strong support level of 500 GBX and commenced a bullish rally. The price started rising and finally reached 650 GBX. The price faced rejection from there and started falling.
In March 2023, the price took the support of 540 GBX and did a small bullish rally. The price faced an immediate rejection and started falling. The price was again seen taking support the trendline coming from below.
However, it was not able to close above the recent high and breaks the trendline support to continue its downtrend.
The price came back to retest the trendline and started falling again. It is continuously making higher low structure in the market which is a bearish sign.
Currently, PHNX Stock price is trading just above 500 GBX support. For the PHNX price to continue its downtrend and higher low structure, it has to give the breakdown of the 500 GBX which is a strong buyers zone. After the breakdown, the price can reach its next support of 470 GBX.
If the price manages to sustain over 500 GBX, it can do a bullish rally till 564 GBX resistance. The price must have to give the breakout of 564 GBX to be in bullish sentiment. After that, the price can be seen at its next resistance of 591.8 GBX.
Technical Indicators’ Prediction About the Current Trend
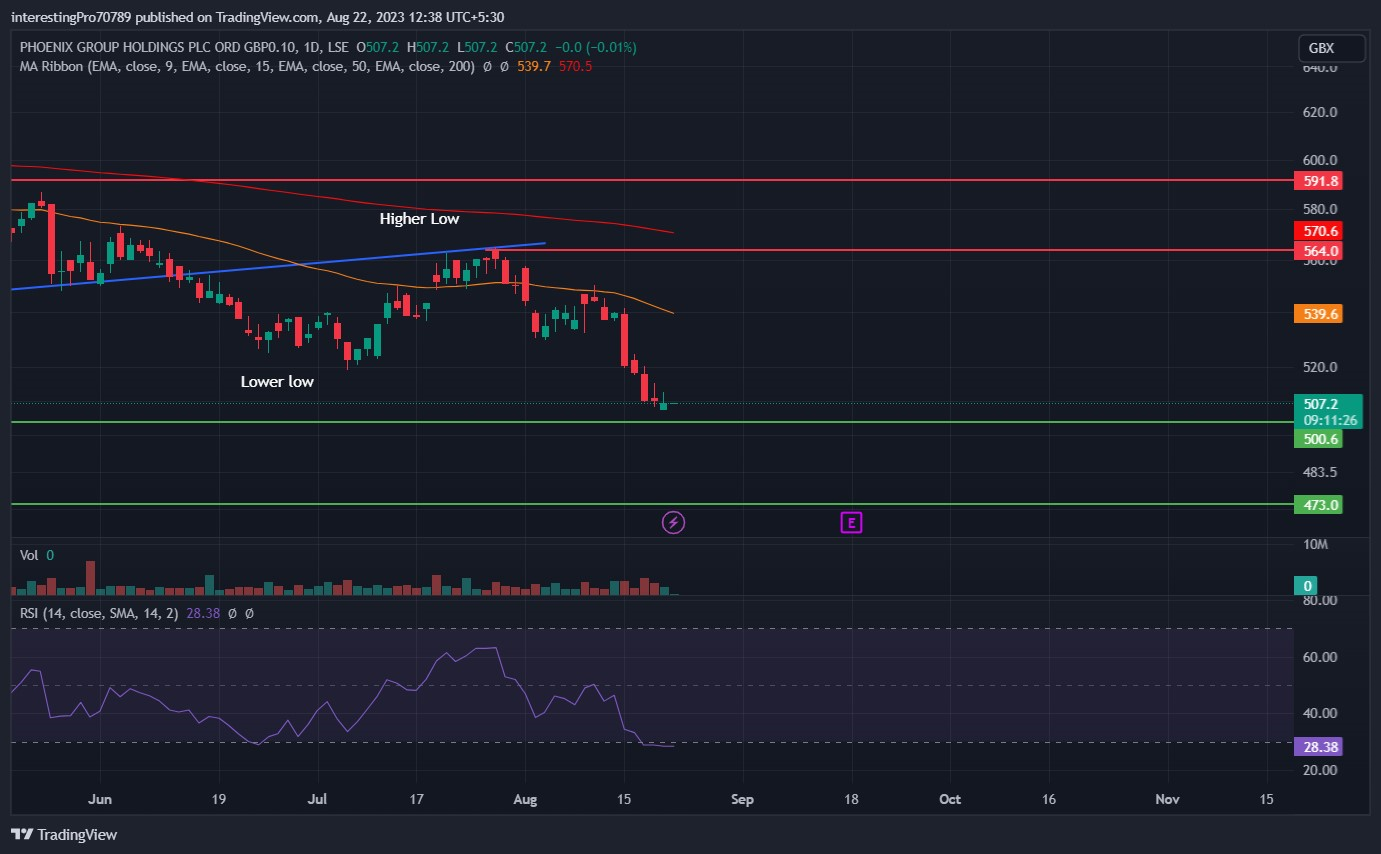
The 50 EMA (yellow line) is at 539.6 GBX and the 200 EMA (red line) is at 570.6 GBX. Recently, the PHNX price has taken resistance from the 50 EMA and showed a bearish move. The Phoenix price is also trading below both EMA. This indicates the bearish sentiment and seller dominance in the price.
The relative strength index (RSI) line is at 28.38. The RSI line is heading toward the oversold territory. This indicates that the price is due for a pullback shortly.
Conclusion
The Phoenix price is in bearish sentiment as it is making a consistent higher low structure with the seller’s complete dominance. It is heading toward the 500 GBX support from where a strong bullish rally was seen in the past. If the buyers regain the control of price at 500 BGX support, a bullish momentum is expected from the 500 GBX. Otherwise, the price can be seen continuing its downtrend till 470 GBX.
All the indicators are bearish at the time of writing but RSI is heading toward the oversold territory. That indicates the price can be seen taking a pullback shortly.
Technical levels
Resistance levels: 564 GBX and 591.8 GBX.
Support levels: 500 GBX and 470 GBX.
Disclaimer
The views and opinions stated by the author, or any people named in this article, are for informational purposes only. They do not establish financial, investment, or other advice. Investing in or trading crypto assets comes with a risk of financial loss.




