
 Minter
 Sui
Sui Pons
Pons NEAR Protocol
 Starknet
 Quack AI
 Chainlink
- HLN stock price is trading at 323.05 GBX.
- The company chart price reflects the bullish sentiment in the market.
Haleon Plc (LSE: HLN) was founded on 18 July 2022. The company deals in the sales of healthcare products. The organization focuses on the healthcare of consumers.
Haleon Plc (HLN) Stock: Financial Analysis
The Haleon company has inconsistent growth in the revenue report from Q1 2022 to Q2 2023.
The gross profit of the company has shown consistent growth in the last quarter of 2022. It failed to maintain consistency in the two Q1 and Q2 reports of 2023.
The company has continuously spent money on research and development since the previous year.
The Company’s first dividend payout in 2022 was 20.91.
Haleon (HLN) Stock: Technical Analysis
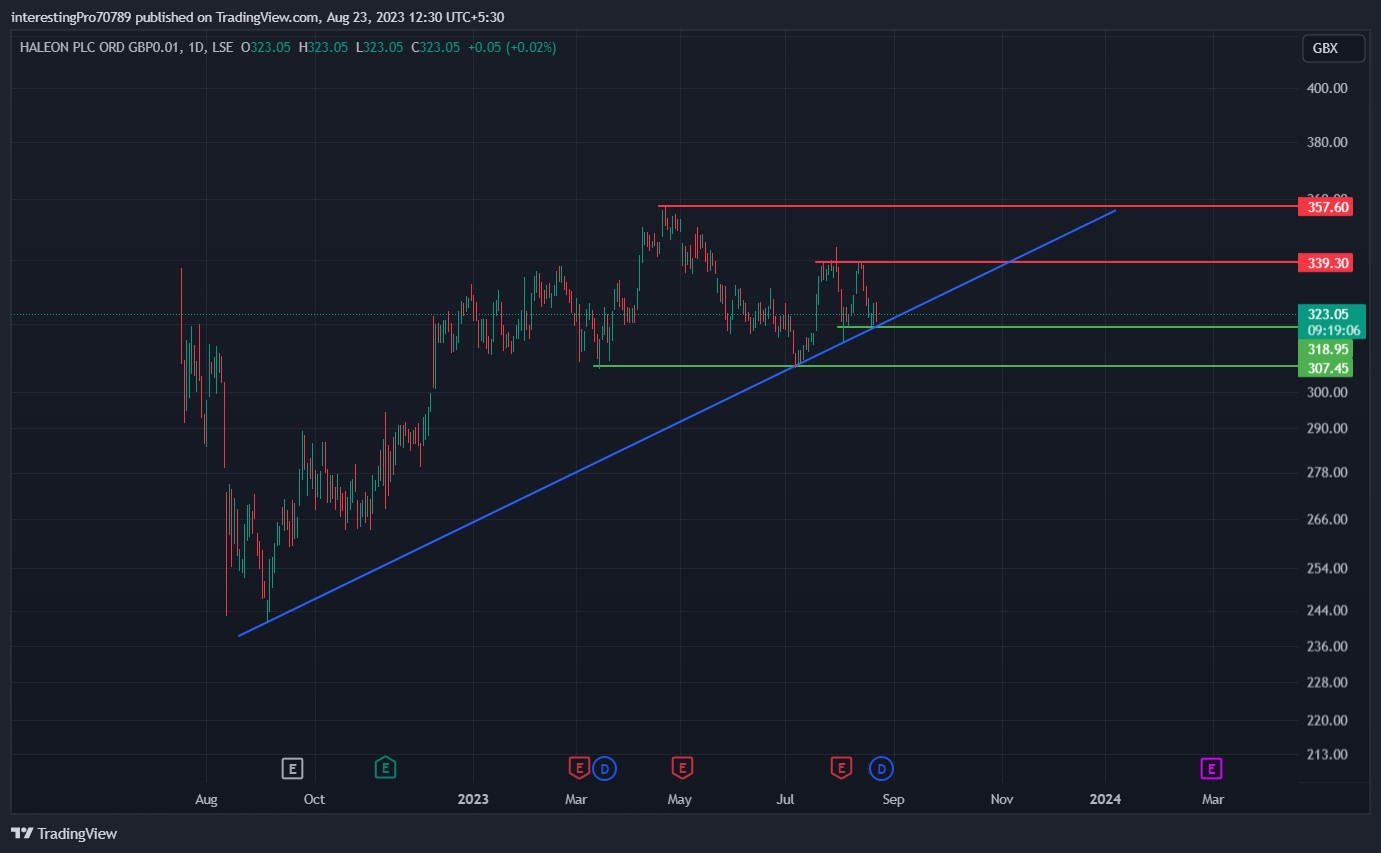
The Haleom price started a bullish rally in September 2022. The price of the HLM stock has been in bullish sentiment from that period onwards.
In March 2023, the HLN stock formed support of 307.45 GBX and commenced a bullish and all-time high of 357.65 GBX. The company’s stock price started falling after that and went to 307.45 GBX.
The price again commenced a bullish rally from 307.45 GBX and faced rejection from 339.30 GBX. Recently, the price formed a double-top pattern and that’s a bullish pattern. The seller doesn’t seem strong because the previous three candles were formed after the two strong bearish candles were bullish candles. This shows that the buyers are still preventing the price from going down.
The price is currently trading at 318.95 GBX or the neckline of the double-top pattern. If the price gives the breakdown of the 318.95 GBX, it can only go down to 307.45 GBX. However, the 307.45 GBX level is also a strong buyer zone. A reversal may occur from that level if the price gives a breakdown of 318.95 GBX.
The price can test 339.30 GBX resistance again if it fails to give the breakdown of 318.95 GBX. The price must give the breakout of the 339.90 GBX resistance in order to continue the bullish trend. After this, the price can be seen doing a bullish rally to its all-time high resistance at 357.65 GBX.
Technical Indicators’ Prediction About the Current Trend
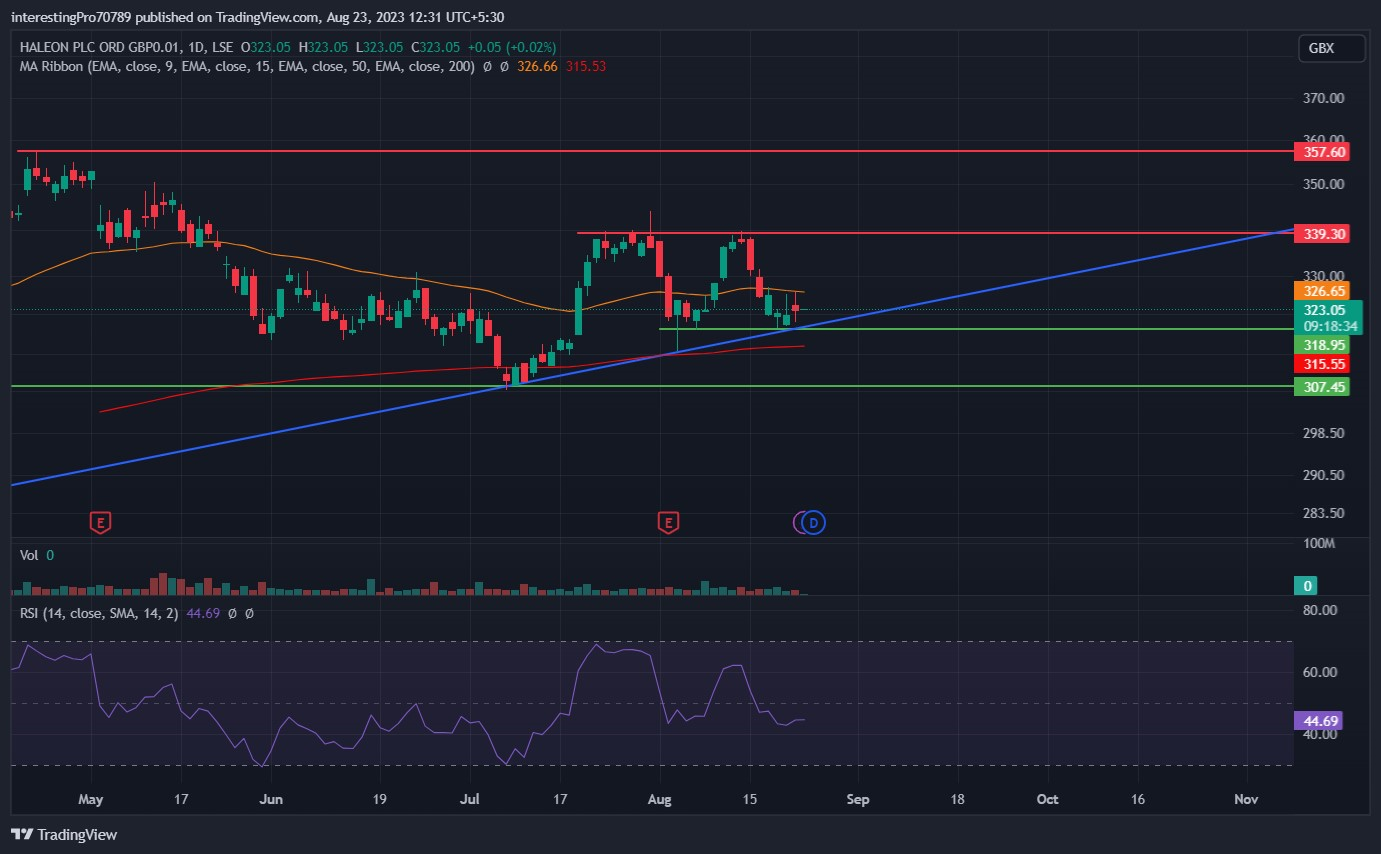
The 50 EMA (yellow line) is at 326.65 GBX and the 200 EMA (red line) is at 315.55 GBX. The price of HLN is currently between both EMAs. It shows the price is in an indecisive state and taking pressure from the sellers as well as buyers.
The relative strength index (RSI) is at 44.69. The RSI is in currently a neutral state showing that the price is taking pressure from both buyers and sellers.
Conclusion
The Overall chart of the HLN is bullish. The last few candles and the indicators show that the price is in an indecisive state. The price is unable to decide the trend of the market as it is taking pressure from both buyers as well as sellers. Traders should wait for the correct levels to place their orders.
Technical levels
Resistance levels: 339.90 GBX and 357.65 GBX.
Support levels: 318.95 GBX and 307.45 GBX.
Disclaimer
The views and opinions stated by the author, or any people named in this article, are for informational purposes only. They do not establish financial, investment, or other advice. Investing in or trading crypto assets comes with a risk of financial loss.




