
 Quack AI
 NEAR Protocol
 Pudgy Penguins
 Pearl
Pearl Quant
Quant Quantus
 Sui
Sui
- SNG stock price is trading at 8.00 GBX.
- The company stock is trading inside a parallel channel.
Donna E. Davies, Ratko Djukanovic, and Stephen T. Holgate founded Synairgen Plc (LSE: SNG) in June 2003. It is a holding company that deals with respiratory drug research and development. The company focuses on severe disease and viral infections.
Synairgen Plc (SNG) Stock: Technical Analysis
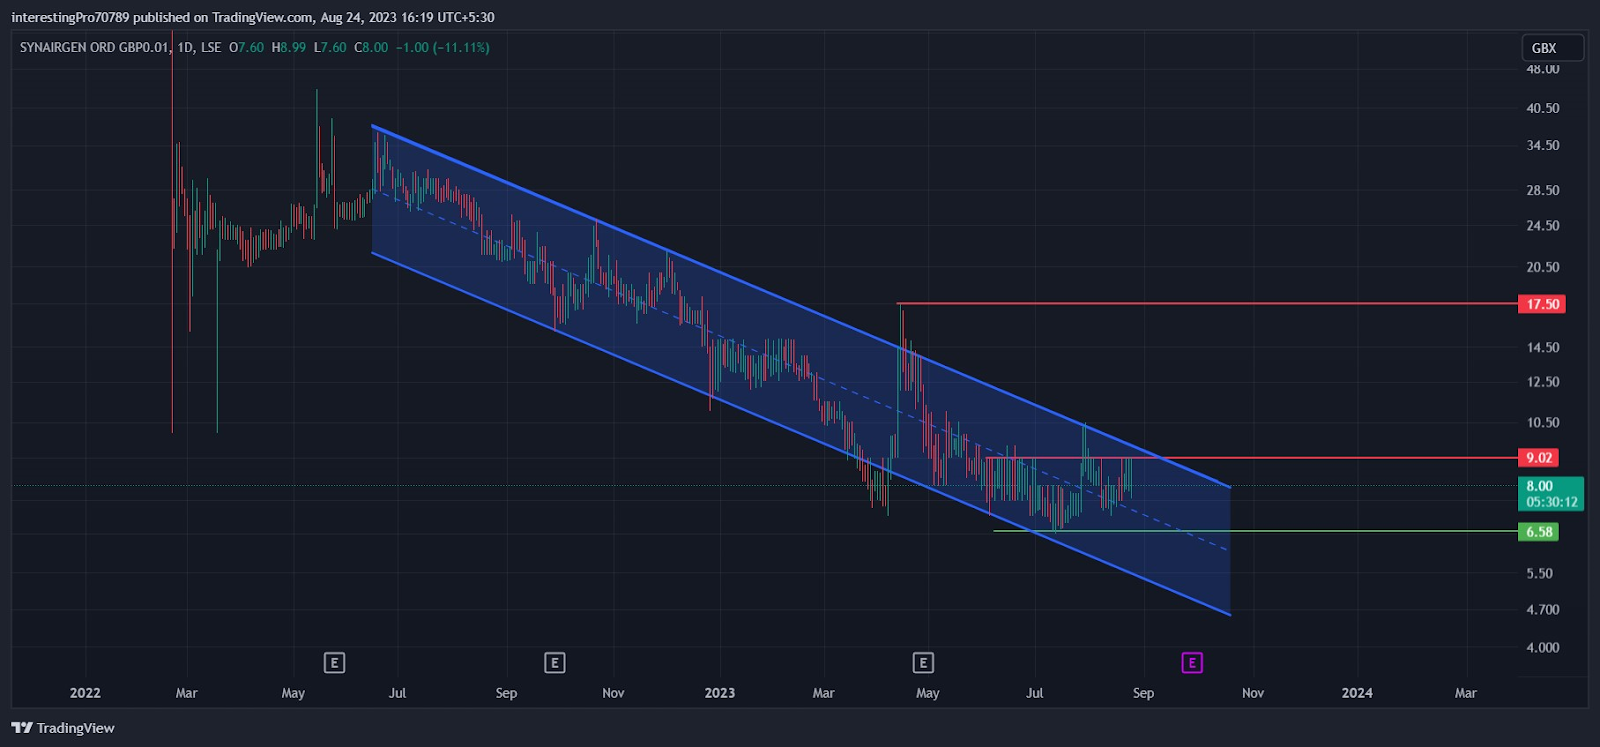
In June 2022, the SNG price started falling from 36.50 GBX. It has been falling in a parallel channel for a very long time. That downward movement shows the absolute dominance of sellers since June 2022.
In March 2023, the price broke the support of the parallel channel, but it faced an immediate rejection. The stock price went back into the parallel channel as soon as it started facing rejection. The breakdown of the parallel channel was turned into a breakdown failure.
The price gave the breakout of the parallel channel in April 2023. Again, it faced an immediate rejection and went back inside the parallel channel. This time the breakout was turned into a fakeout.
The price got stuck in the narrow zone of 9.02 GBX to 6.58 GBX in June 2023. Currently, the price is trading in the narrow zone and the parallel channel. If it gives the breakdown of the parallel channel and the 9.02 GBX level, it may continue its downtrend. The price may give the breakout of the parallel channel and the 6.58 GBX. It may rest at the 17.50 GBX resistance if that happens.
Technical Indicators’ Prediction About the Current Trend
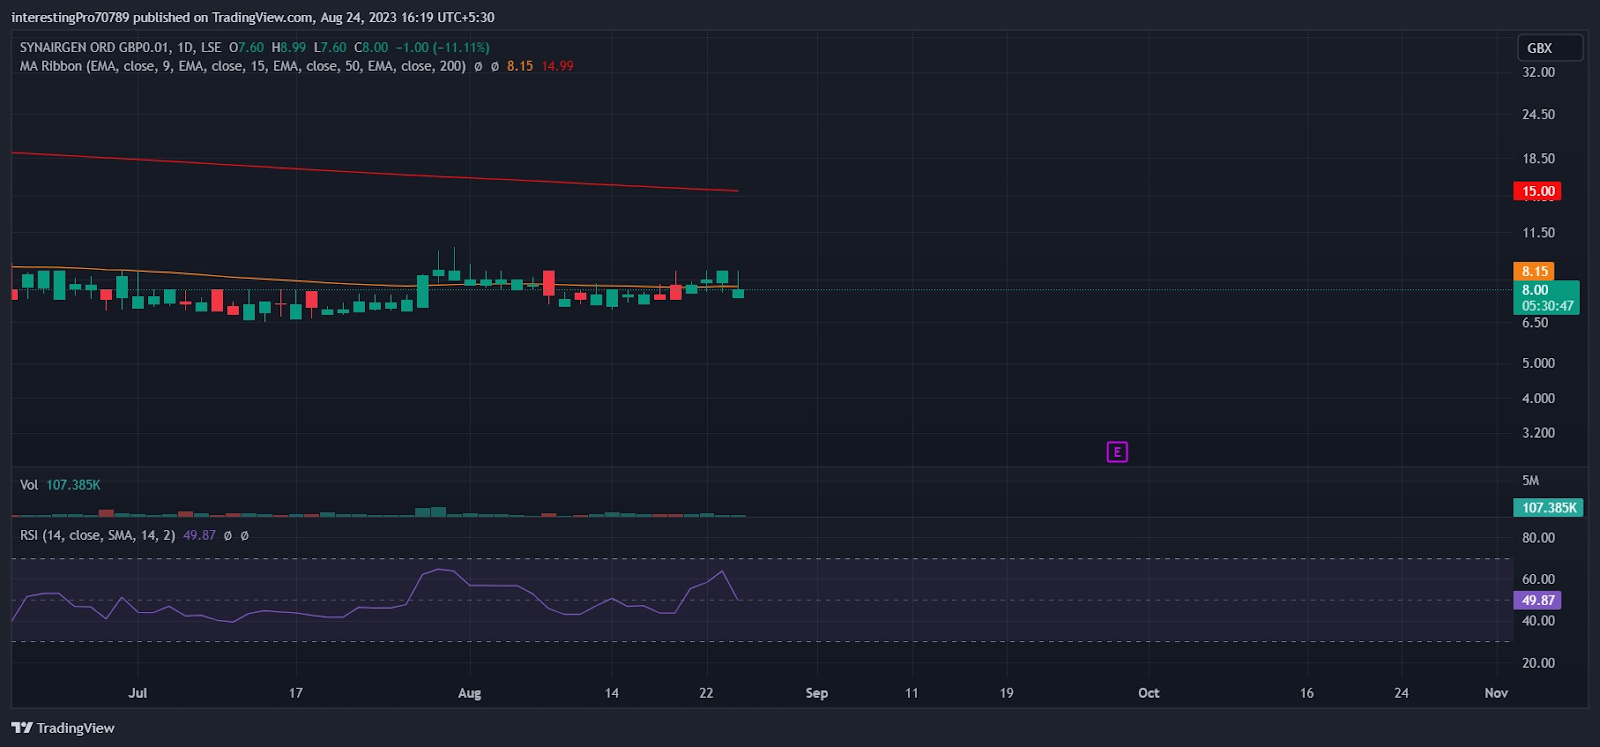
The 50-EMA (yellow line) is at 8.15 GBX and the 200-EMA (red line) is at 15.00 GBX. The price of SNG is trading below the 50 and 200 EMA. This indicates the price is in bearish sentiment at the time of writing.
The relative strength index (RSI) is at 49.87. The RSI indicates that the price is taking pressure from both bulls and bears at the current level.
Conclusion
The Synairgen stock price is in bearish sentiment. The price is currently trading inside the parallel channel. If it gives the breakdown of the parallel channel, it may maintain the downtrend. However, the stock value may reach the next resistance at 17.50 GBX if it closes above the parallel channel. All the indicators are bearish or neutral at the time of writing.
Technical levels
Resistance levels: 9.02 GBX and 17.50 GBX.
Support levels: 6.58 GBX
Disclaimer
The views and opinions stated by the author, or any people named in this article, are for informational purposes only. They do not establish financial, investment, or other advice. Investing in or trading crypto assets comes with a risk of financial loss.




