
 Quack AI
 Pearl
Pearl Solana
 NEAR Protocol
 Canton
 XRP
XRP Derive
- The BHP stock price is trading at 2212 GBX.
- It is currently in a consolidation phase and is trading near its support and is waiting for a breakdown.
BHP Group Ltd. was founded on August 13, 1885. It is a mining company that deals in the exploration, development, production, and processing of iron ore, metallurgical coal, and copper. The company operates through four segments which are Petroleum, Copper, Iron Ore, and Coal.
BHP Group Ltd. Stock: Financial Analysis
The BHP company has shown inconsistent growth in revenue reports over the past three years. The company showed growth in its revenue reports in 2020 and 2021. The company’s revenue declined by 0.20% in 2022.
The estimated revenue value is expected to be 41.28 Billion GBP in the 2023 revenue report. The company has always managed to close its revenue near the estimated revenue.
The company has a 50-plus dividend payout ratio over the past three years. It shows that the company has performed well during the last three years.
BHP Group Ltd. Stock: Technical Analysis
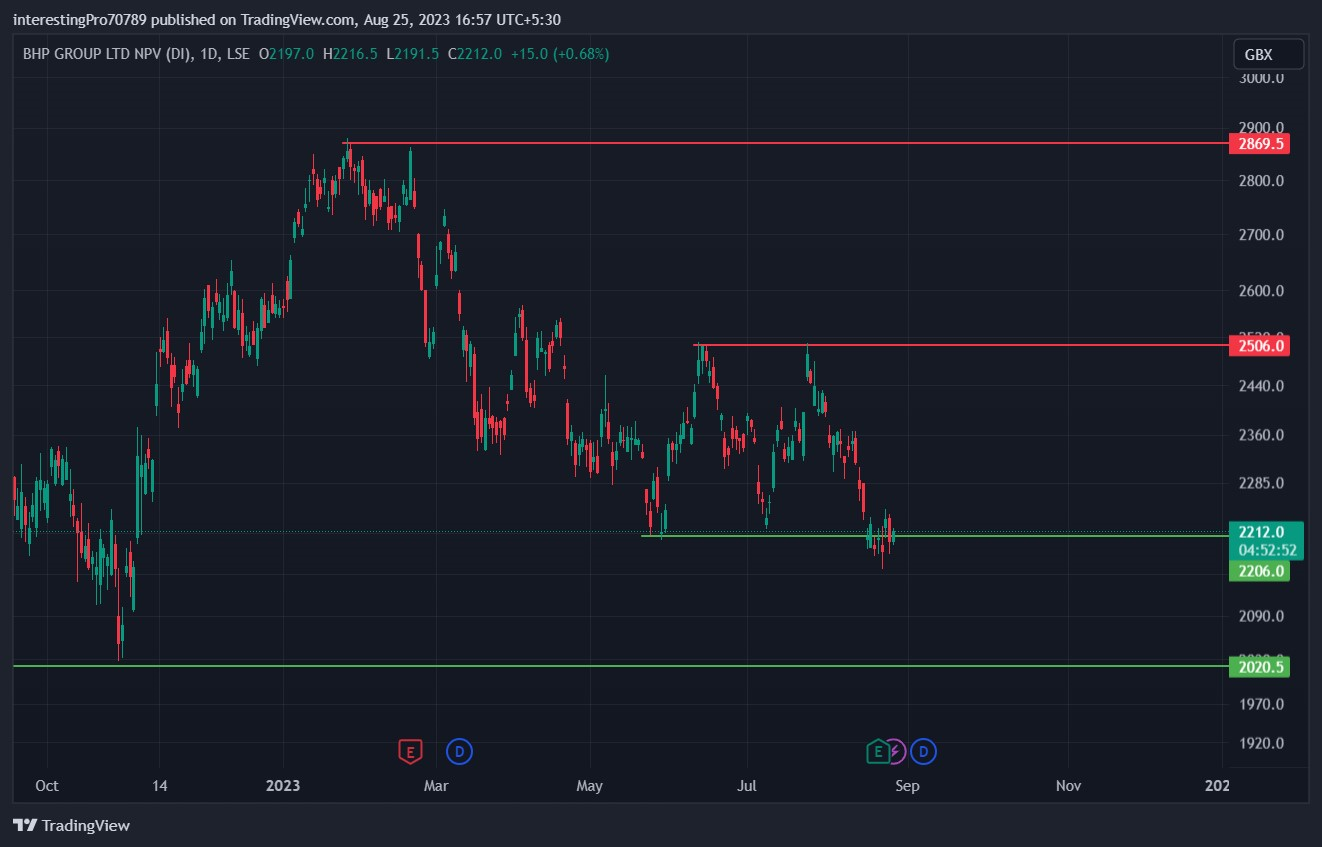
The BHP stock price formed support at 2020.5 GBX in November 2022 and did a bullish rally. The price after reaching 2869.5 GBX got exhausted and started to fall. It fell to the 2206 GBX support.
The price took support from the 2206 GBX in June 2023 and commenced a bullish rally to 2506. The price faced rejection from the 2506 GBX and was stuck between these two levels. Every time the price reaches 2206 GBX support, buyers push it in the upward direction to 2506 GBX resistance. The sellers force the price to fall towards the 2206 GBX support whenever it reaches 2506 GBX resistance.
Currently, the price is trading at the 2206 GBX support. The price is still inside the 2206 GBX support and 2506 GBX resistance. If the price breaks below the 2206 GBX support, it may fall to the next support of 2020.5 GBX. However, if buyers show their strength again, they can push the price to 2506 GBX resistance.
The Breakout of 2506 GBX resistance and the breakdown of the 2206 GBX support will decide the future direction of the price. The breakout of 2506 GBX resistance will cause a rise in price to 2869.5 GBX. The breakdown of 2206 GBX support will cause a fall in price to 2020 GBX.
Technical Indicators’ Prediction About the Current Trend
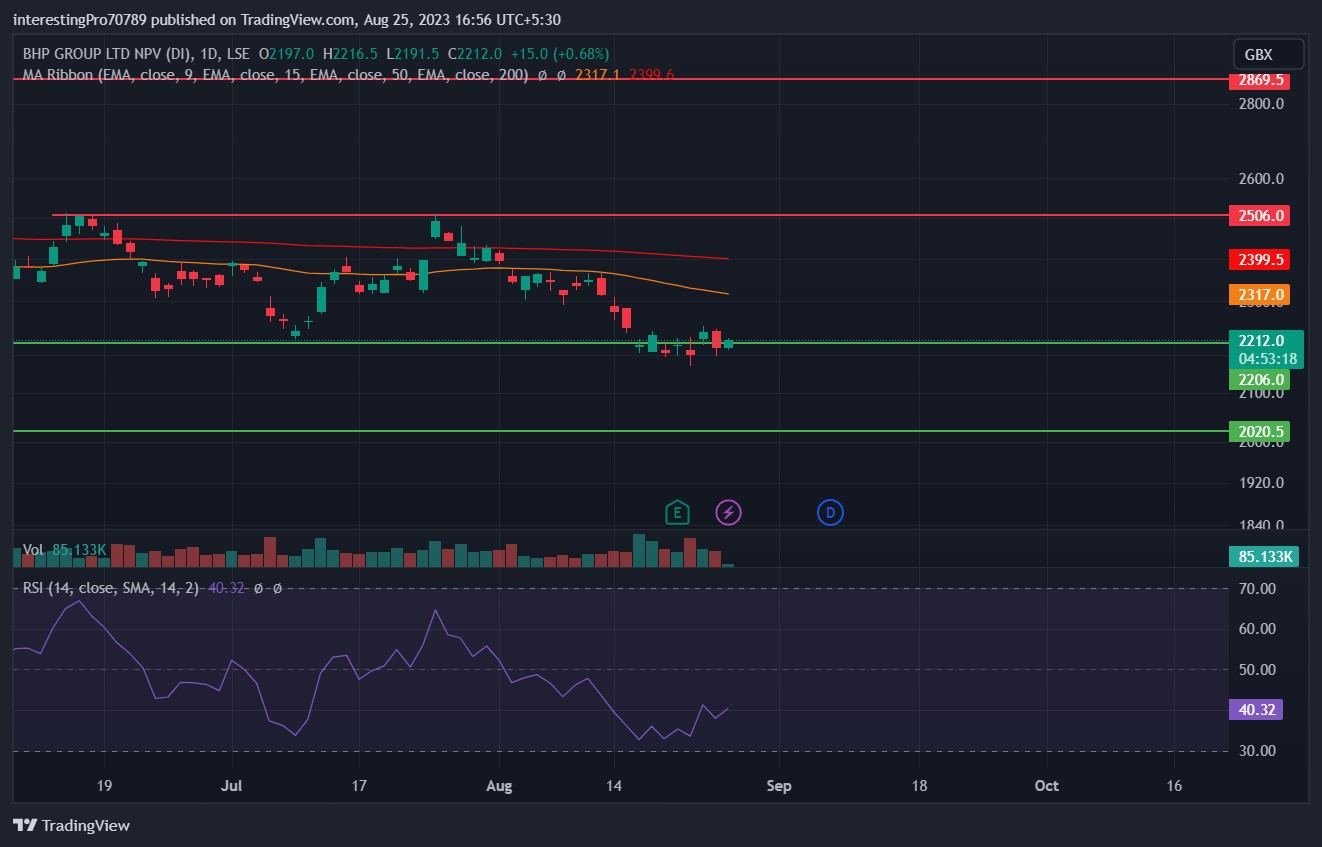
The 50-EMA (yellow line) is at 2317 GBX and the 200-EMA (red line) is at 2399.5 GBX. The price of BHP is trading below both the EMA’s. However, the EMA lines are sideways because the price is stuck between two levels. This indicates that the price is currently bearish with sellers’ dominance over the price. Buyers also show their presence at the 2206 GBX support.
The relative strength index is at 40.32. The RSI line is in the bearish territory but its line is moving toward the neutral territory. That indicates the price can move up in the range of 2206 GBX and 2506 GBX.
Conclusion
The BHP stock price is in a sideways phase as it is trading between the 2206 GBX support and 2506 GBX resistance. The breakout or breakdown of these two levels will decide the future trend. Meanwhile, traders can put their long positions at support with a strong bullish candle confirmation. They can hold till 2506 GBX resistance. AT 2506 GBX resistance, traders can put their short position. They can hold till 2206 GBX support unless and until the price breaks these two levels.
Technical levels
Resistance levels: 2506 GBX and 2869 GBX.
Support levels: 2206 GBX and 2020.5 GBX.
Disclaimer
The views and opinions stated by the author, or any people named in this article, are for informational purposes only. They do not establish financial, investment, or other advice. Investing in or trading crypto assets comes with a risk of financial loss.




