
 streamoors
 IGNITION
 Injective
 Quantus
 NEAR Protocol
 Pearl
Pearl LayerZero
- BP Plc stock has been trading sideways since May, disappointing its investors.
- Despite the company’s strong fundamentals, the stock has given almost 0% returns this year.
- As the stock consolidates, investors are eagerly waiting for a big breakout in the stock.
BP plc. (formerly The British Petroleum Company) is a British multinational oil and gas company headquartered in London England. It is one of the oil and gas “supermajors” and is one of the world’s largest companies in terms of revenues and profits. It is a vertically integrated company that operates in all areas of the oil and gas industry. including exploration and extraction, refining, distribution and marketing, power generation, and trading.
Financials for the company look really good as total revenue per quarter and year, has been constantly increasing with a constant amount of net income generation for the company and its shareholders. As of now, the financials look very strong, which is a big positive for investors.
Technical Analysis
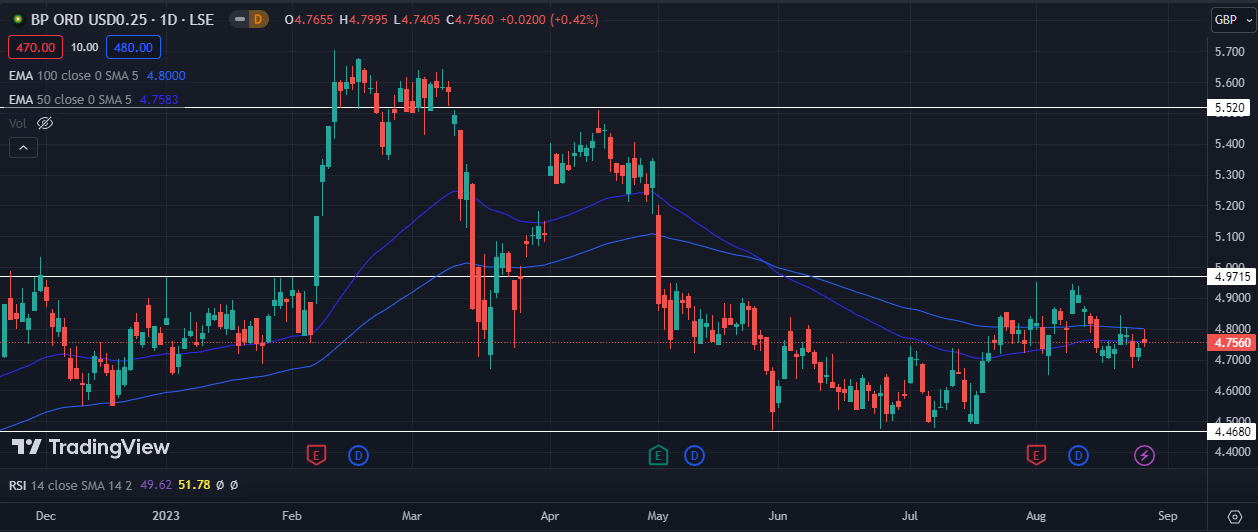
A daily chart shows high volatility in the stock throughout the year. The stock created a high at £5.65 in mid-February but then saw a sharp sellin after this.
The stock is currently trading sideways in a zone between £4.468 and £4.971. The BP Plc has not attempted to breach out of this zone even once, making it a strong demand and supply zone. As long as the stock trades in this zone, traders should try to stay away from making any move.
The market looks confused as we see a huge number of doji candles. The volumes also look somewhat weak as of now. If the stock breaks out of the current zone in the future. £4.971 can be a good entry price with a target of 5.52£. However, this should only be considered if there are strong buying volumes.
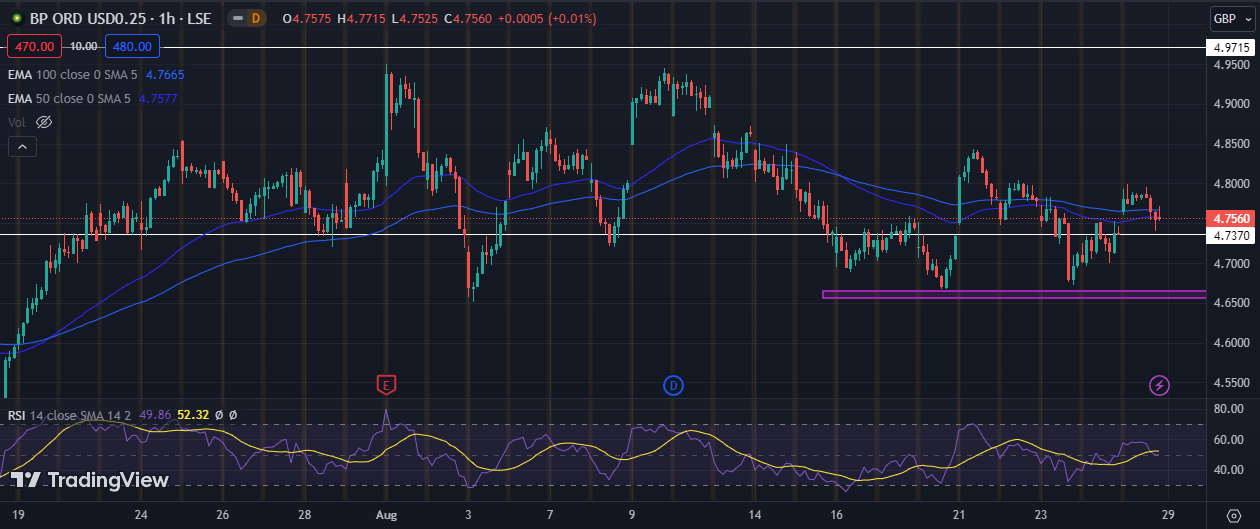
On an hourly chart, the stock looks a little weak as of now. The stock has been very narrowly trading above its support at £4.737. and it has also breached this level several times.
The recent market activity for the past week indicates a remarkably bullish trend. characterized by a notable decrease in trading volumes. Notably, the selling side has exhibited significant activity during this period. The prevailing market conditions are providing robust indications of a selling bias, potentially indicating a shift in sentiment.
An important consideration lies in the current support level at £4.737. Should this support level be breached once again, it could signal a substantial downward movement for the stock.
£4.661 is our first target and support in case of a downside. Below this, 4.548£ is our next target. and looking at the current setup. these levels look very achievable as of now.
If we see a recovery in the stock from here, £4.845 looks like a good target, and could serve as an immediate resistance.
Conclusion
The company looks very strong financially and fundamentally. It can be a great investment in the long term according to analysts. but as of now, the stock looks weak technically. One should ideally wait for a month at least so that the stock reaches a comfortable level. from where a downward movement is less likely to occur. Traders should be highly alert as good opportunities lie ahead for the stock. Overall, the current view on the stock is highly bearish.
Important technical levels
Major support levels: 4.737£ followed by 4.65£.
Major resistance levels: 4.85£ followed by 4.971£.



