
 Injective
 Celestia
 streamoors
 Sui
Sui Pudgy Penguins
 Bitcoin
 Pearl
Pearl
- Imperial Brands Plc financial highlights and statement analysis.
- The company focuses more on stable and consistent revenue than heavy reinvestment.
- The IMB stock got a bearish momentum, but the RSI has indicated a possible trend reversal.
Imperial Brands Plc was founded in 1901. It is a listed company on the London Stock Exchange. It produces and markets cigarettes, tobacco, cigars, rolling papers, and tubes. Its operations are mainly divided into two segments, one is Tobacco and the Next is Generation Product (NGP). The company is headquartered in Bristol, the United Kingdom, and is led by the CEO, Stefan Bomhard.
Financial Analysis of IMB Stock
The financial analysis of Imperial brand PLC starts from the good old income statement. The company is reporting stagnant revenue growth, which is not changing more than 2% to 4% Year-on-Year. However, the company is making a decent revenue of up to £17 Billion.
As per last year’s annual report, the company was able to make up to £5.56 Billion in gross profit. It maintained a gross margin of 33.4%. Moving further down to its operations, the company is taking away £3.4 Billion. It is about 20% of the Revenue. The IMB stock is making a net income of £1.57 with a net margin of 9.2%.
The positive net income has created a way for some ratios. Return on equity is on a decent value of 25% and return on assets is 5%. The price-to-earnings ratio is at 11.26, which is the result of the fall in stock prices. With a stable net income, the IMB stock is giving an attractive dividend yield of 8.92%. It is offering an amount of £1.39 as a dividend per share.
The financial statements of the IMB stock reveal that the company is focused on stability and a consistent dividend payout. It aims to maintain its financial value.
The Balance Sheet and Cashflow Statement
The company’s balance sheet is looking pretty stable. The Assets sides are showing stable investments in both the long and short term. Looks like the company is focusing on keeping a big chunk of cash to liquefy when needed.
The liabilities side shows how efficiently the company is managing its long-term debt. Even with a recurring year-on-year revenue, it has shown no hurry in repaying loans. However, the Debt to equity ratio is 1.89 and it may pinch some investors.
The cash flow statement shows a constant flow of cash from its operating activities, with a CFO of £2.83 Billion last year. The company has managed its working capital decently throughout the years. The CFO/sales ratio is 16%, which is an impressive percentage.
The net cash flow is also positive at £2.6 Billion after giving the dividends of £1.32 Billion. The same ratio has been for the positive net cash.
The figures and the KPIs are calculated by the annual reports provided by Trading View & Yahoo Finance
Technical Analysis of IBM stock
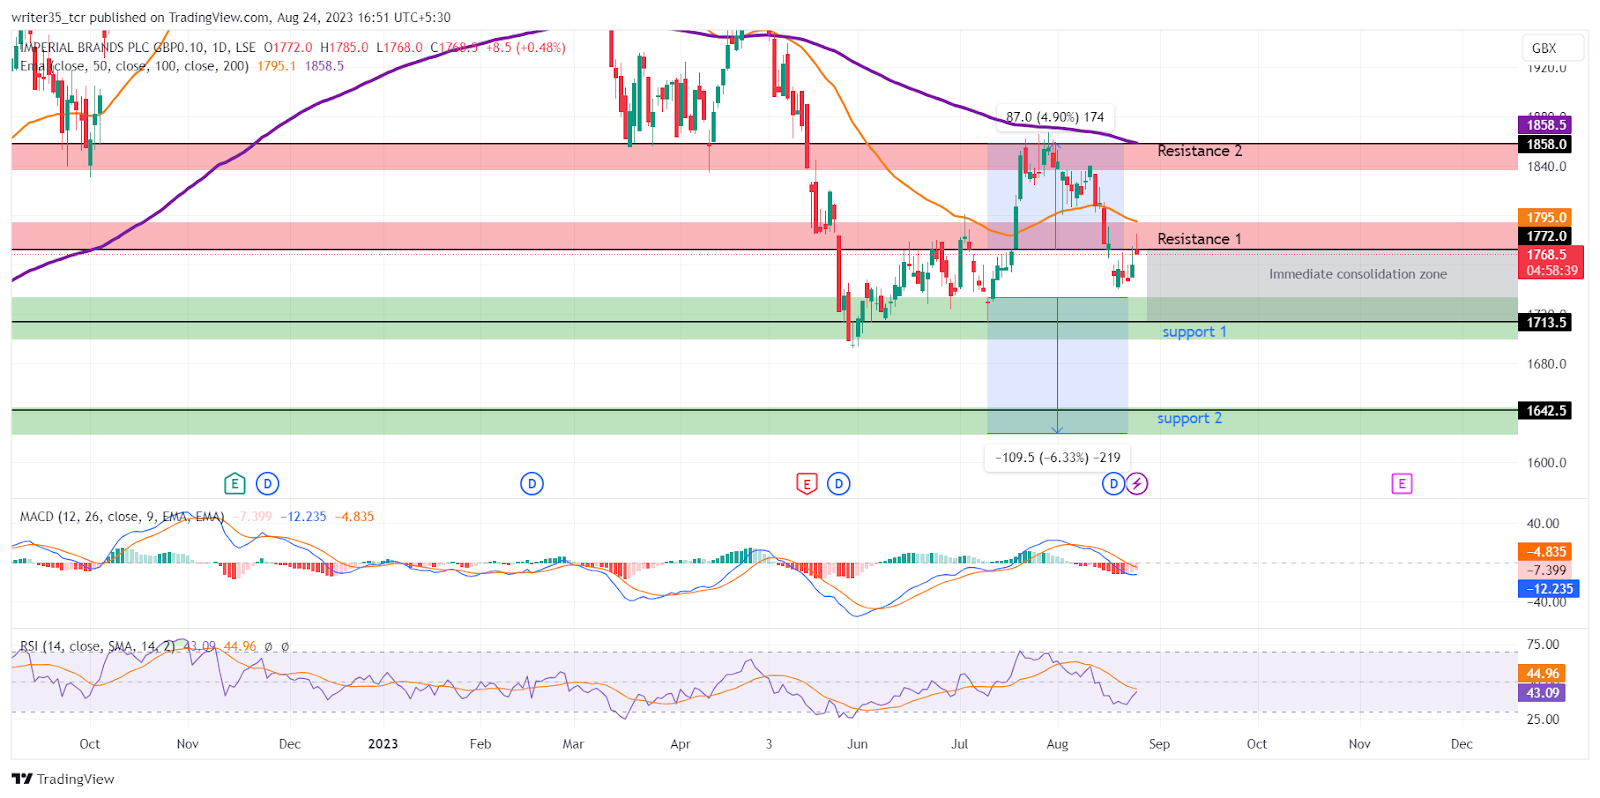
The IMB stock price has broken its support level of £1,772 at the time of writing. However, the fall was controlled by the bears in the mid-journey toward its support level.
There are some support and resistance levels for the current price levels. The indicators are suggesting some potential movements soon. It can be used to make informed decisions and take advantage of present market trends.
If we look at supports and resistances for the current price level, the first and immediate support is at £1,713. The stock price is near the immediate resistance level of £1,795. The second support and resistance levels are at £1,642 and £1,858 respectively
What Do Indicators Signal?
Between these supports and resistances, indicators like RSI are showing a possible signal of a trend reversal. The RSI line started coming down after touching its overbought level of 70 in July 2023.
The SMA of the RSI line made a bearish crossover back at the beginning of August month. this crossover led to the the current scenario where the RSI line has spiked up from its over-sold zone. It is looking to make a bullish interaction with its SMA. The RSI and its SMA are at the level of 43 and 44 respectively
On the other hand, the MACD is showing a possible bearish trend. This indication is the continuation of the bearish crossover that occurred between the MACD line and its EMA at start of the August. As of this writing, both lines are below the neutral zone of the MACD graph. The MACD line is at -12.15 while its EMA is at -4.81.
The exponential moving averages are both above the above price. The 50 and 200 EMA entered into a bearish crossover back in April. The IMB stock price came crashing down below both of the EMAs.
At present, the 50 EMA is at the level of £1,795. That is just above the price and in touch with the immediate resistance zone. However, the 200 EMA is on the point of the 2nd resistance level which is £1,85.
Is it worth buying IMB stock?
Looking from a long-term perspective, the company is showing stable and consistent profits, cashflows, and dividends. However, the stock hasn’t done well since 2016. The reason is the lack of growth. Furthermore, if you are focused on recurring income from dividends, the IMB stock could be a perfect investment. If looking for capital gains, this company could be a nightmare to invest in
The short-term traders have to wait for IMB stock price to show some momentum above its immediate resistance of £1,772. However, the RSI has given a possibility of a bullish reversal. The Bulls will have to show good momentum to break its 50 EMA and first resistance together as they are on the same level. A stop loss can be made on £1,734 which is the end zone of the first support level.
Technical levels
Support: £68.9, £64.6
Resistance: £74.1, £79.0
Disclaimer
The views and opinions stated by the author, or any people named in this article, are for informational purposes only. They do not establish financial, investment, or other advice. Investing in or trading crypto assets comes with a risk of financial loss.



