
 Minter
 Bittensor
 Hyperliquid
 NEAR Protocol
 Monero
 Pearl
Pearl Quantus
- The stock price of PTEC has experienced a downfall since its last high at the end of July 2023.
- The stock price was in an uptrend due to a surge of some metrics in its earnings report.
- A bounce back is expected as the stock is near its immediate support, but the RSI and MACD have something interesting to show.
The share prices of PTEC stock started rising after the release of its June 2022 half-yearly report. A 68% year-on-year growth was seen in the revenue. However, the company was positive till its operating profit with a margin of 88%.
With a net income of £62M in last year’s annual report, the price-to-earnings ratio of PTEC stock is 25.6. Its return on equity is coming up to just 2,44%. However, the company is still very low on long-term debt as its Debt-equity ratio is 0.37.
Technical Analysis & Prediction of PTEC Stock Price
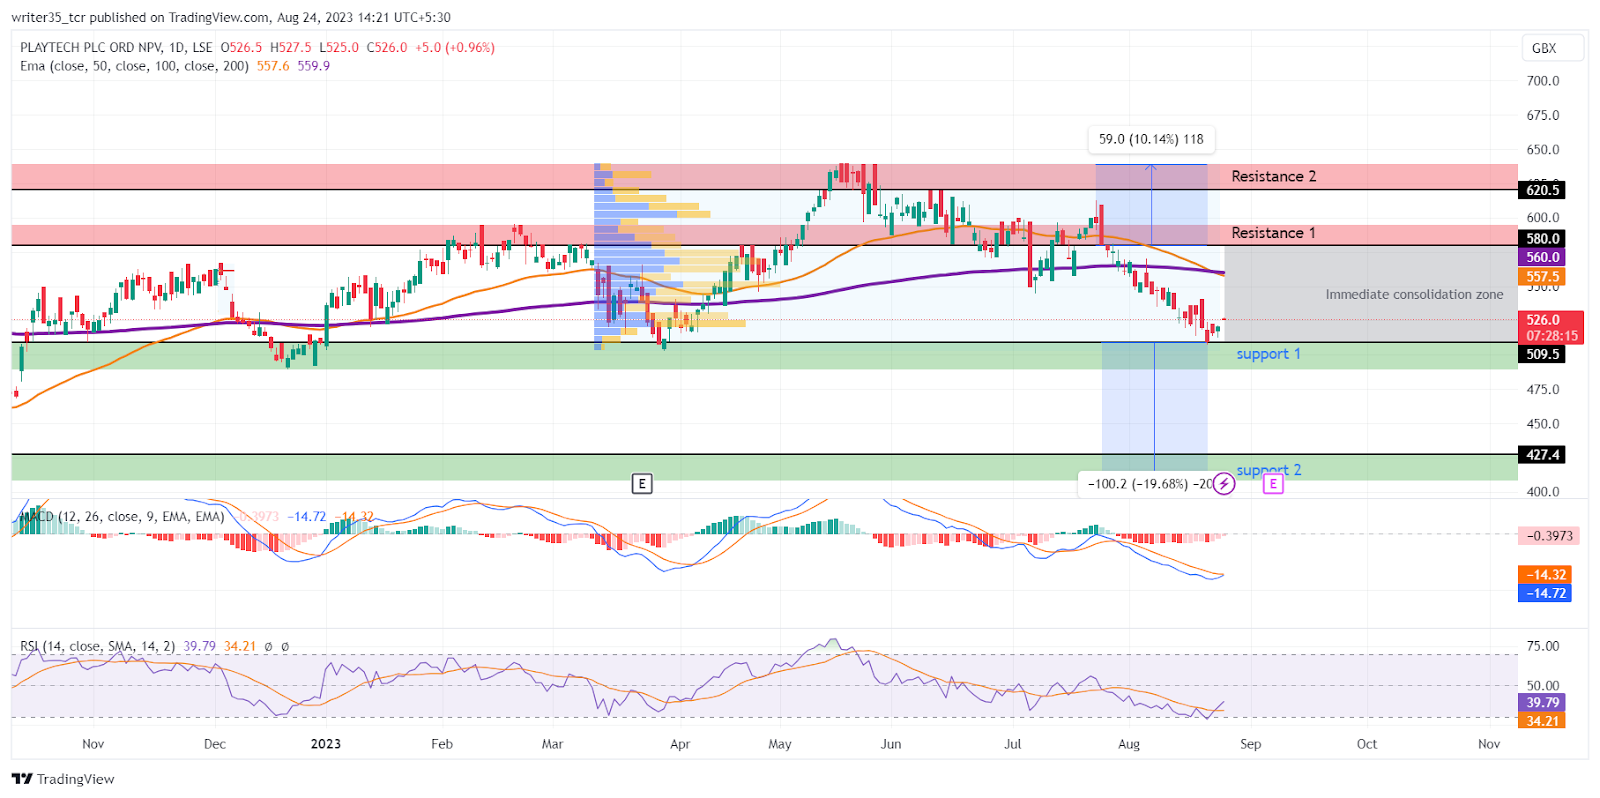
The PTEC stock price is currently trading at the level of £518. The bears pushed the price further down its EMAs after breaking a support level of £580. At present, the PTEC stock price is looking to bounce off its immediate support level of £509. This could be the start of another high toward its immediate resistance level of £580.
The second support level is about 19% down below the first one at £427. That occurred because the stock was in a bullish rally from September 2022. If we look at the 2nd resistance level, it is up 10% from the first one, at £620.
What the Indicators are Saying?
Between the supports and resistances, Indicators like MACD are showing a bearish trend after the MACD line made a crossover with its EMA back at the end of July 2023. At present, however, a trend reversal is visible in the graph.
The MACD line has risen above and looking to make a bullish crossover with its EMA. This happened after the PTEC share price bounced off its support. Currently, both lines are meeting at the level of -14 in the MACD graph.
The RSI, on the other hand, has already been rising above its SMA line. This is after making a crossover 2 days before writing this post. The bullish crossover indicates a rise in the strength of buying volumes. At present, the RSI line is at the level of 39 and rising to the neutral zone of 50.
After the two well-known indicators, let’s take a look at Exponential Moving Averages. The 50 EMA has made a bearish crossover with the 200 EMA. Consequently, the PTEC stock price is falling after breaking its support level. The present level for the EMAs is £560 for the 200 EMA and £557 for the 50 EMA.
Conclusion
The price prediction for PTEC stock price is looking bullish in the short term if the bulls can break past both the EMAs. Since a bounce-off is confirmed by the MACD and RSI, a short-term rise may take place.
Technical levels
Support: £509, £427
Resistance: £580, £620
Disclaimer
The views and opinions stated by the author, or any people named in this article, are for informational purposes only. They do not establish financial, investment, or other advice. Investing in or trading crypto assets comes with a risk of financial loss.




