
 Dacity Coin
 astronaut
 streamoors
 Celestia
 NeoSoul
 Sui
Sui Injective
- The stock price of FDEV has experienced a downfall for 3 years
- The company is reporting some decent financial values despite the market conditions. Know below.
- MACD and RSI are a little bullish! Let’s find if it’s the right time to make a long in this stock
Frontier Developments plc’s share price has seen a fall of more than 75% in the last three years. The long-term investors in the stock seem puzzled. The company experienced a decent revenue growth of more than 25% this year. The FDEV stock price momentum is still bearish.
One of the mind-boggling things is the company’s earnings per share. It grew over 40% during that period and it has contributed to its Return on equity of 15% currently. This opens up a new maze of why the stock is still falling. There are no negative news or weak Financials!
Technical Analysis and Prediction of FDEV Stock Price
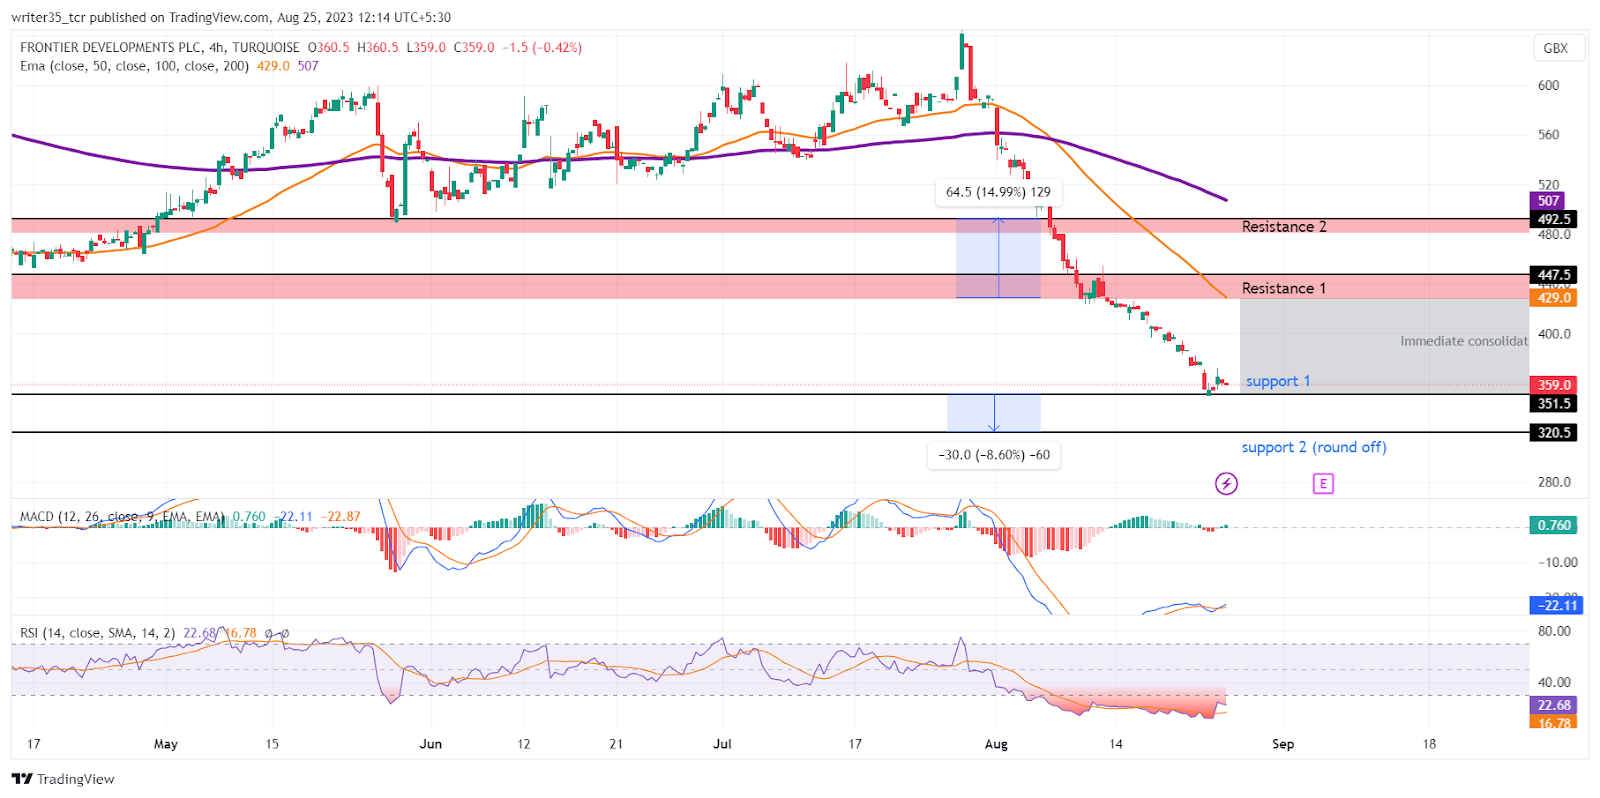
The FDEV stock price started falling after breaking its EMAs back at the beginning of August this year. The bears took over and broke all the previous supports available. It made the price fall freely until it took the immediate support of £351 at the time of writing.
That immediate support is weak because it doesn’t have any confirmation. The price has been at an all-time low in the last 6 years. The second support is being made at the psychological support of £320, which is a round-off.
Even though the support levels are weak, the resistance is stronger than ever. The immediate resistance is being made at the level of £448. Its zone is down below till some deviating candles. The second resistance on the other hand is getting ready at the level of £492. It was a major support broken in this August.
What the Indicators are Showing?
Between these supports and resistances, indicators like MACD are showing a deep downward fall. The MACD line came down below its neutral zone of zero back at the start of August.
The interesting thing to note is that the MACD and its EMA gave a bearish crossover 3 days before the price broke its EMAs and crashed. Currently, the MACD line and its EMA are showing some bullish signs with levels of -22.11 and -22.87.
The RSI graph shows how the FDEV stock price is in an oversold zone of 22. It came down from its neutral territory of 50 back at the end day of July. However, a bullish crossover with the SMA is visible. It is at the level below the RSI, at 16.
The EMAs on the other hand are way above the current price action in the FDEV stock. The 50 EMA is at the level of the end zone of the immediate resistance at £419. Moreover, the 200 EMA is miles above at £507.
Conclusion
The FDEV price prediction will be bearish until the stock makes any significant recovery and confirms its support. The current momentum is bearish but the MACD and RSI have given some uptrend signals. If the price bounces off its current support, a risk-averse long trade can be taken.
Technical levels
Support: £351, £320
Resistance: £447, £492
Disclaimer
The views and opinions stated by the author, or any people named in this article, are for informational purposes only. They do not establish financial, investment, or other advice. Investing in or trading crypto assets comes with a risk of financial loss.



