
 Minter
 Quack AI
 STONK
STONK Pons
Pons Sui
Sui Pearl
Pearl Bittensor
- The stock price of WG has experienced a downfall of more than 34% after certain news. Know more below
- The Stock price has been right between both the EMAs. Let’s find out where to take a position.
- MACD and RSI are bearish, while the stock has bounced off its immediate support.
The stock gave a huge gap-down opening back on May 15. It fell more than 34% after the news started floating in the market.
Apollo, which is a private equity firm, showed an interest in acquiring Wood Group earlier this year. The company agreed to offer Appollo access to conduct a due diligence report.
On May 15, Apollo said that it would not proceed with the acquisition of the Wood Group even after the 5th attempt. This news made the price fall harder than a rock from the sky. However, none of the two companies have given any statements about the reasons for this deal cancellation. That is again suspicious news for the Wood Group shareholders.
Technical Analysis and Prediction of WG Stock Price
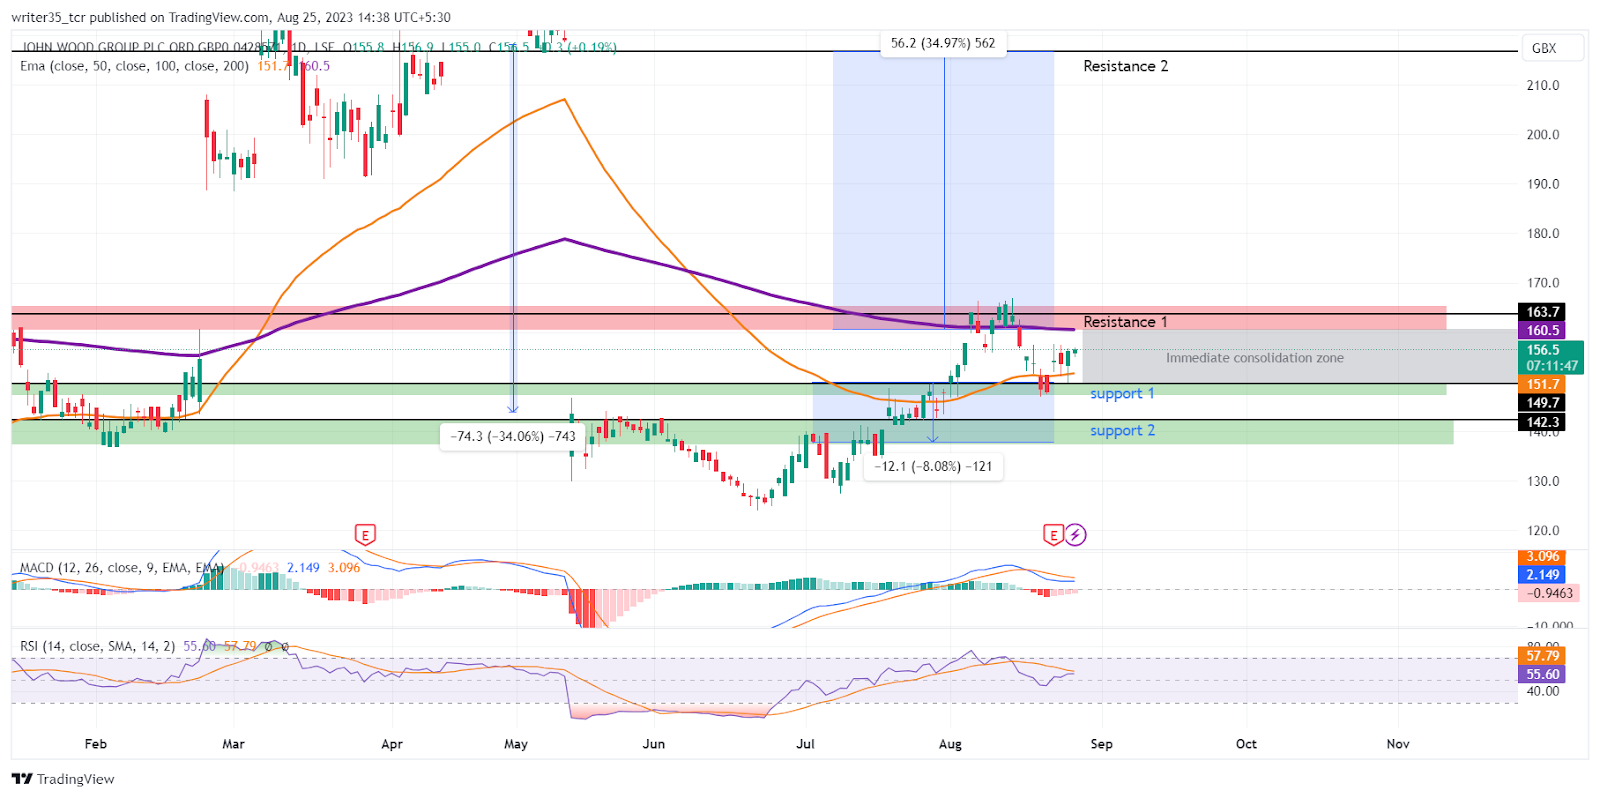
Currently, the WG stock price is in a slight uptrend as it is engaging with its EMAs. The immediate resistance for the stock is at the level of £149, where the stock just took a bounce off. Moreover, the second support is 8.8% down below the level of £142. It was a broken resistance back at the end of July this year.
After the supports in the bottom, resistance 1 is at the level of £163. If the stock price breaks this supply zone, the second resistance is on the gap-up level of £216, 34% above.
What the Indicators are Showing?
Between supports and resistances, indicators like the EMA are showing an interesting pattern. The stock price crossed its 50 EMA on the first day of August. It took the support again on the 18th of August. Currently, it is on the level of £151.
The 200 EMA is up on top of the WG stock price. However, the bulls tried to push past it but bounced off from the immediate resistance. At present, the 200 EMA is at the level of £160.
The MACD graph shows that both MACD and EMA lines crossed above the neutral level of zero. Currently, the lines are making a bearish crossover with each other. The MACD and its EMA are at the level of 2.125 and 3.091 respectively.
Finally, the RSI graph shows that the SMA of the RSI made a bearish crossover on the 14th of August. This event took place when the RSI spiked down from its overbought levels of 70. Currently, the RSI is at 54 while its SMA is at the level of 57.
Conclusion
The WG stock price prediction will be bullish if the stock crosses its immediate resistance zone and its 200 EMA. Both are on the same level! Otherwise, the stock will fall after breaking the support and its 50 EMA, which are again on the same levels.
Technical levels
Support: £149, £142
Resistance: £163, £216
Disclaimer
The views and opinions stated by the author, or any people named in this article, are for informational purposes only. They do not establish financial, investment, or other advice. Investing in or trading crypto assets comes with a risk of financial loss.




