
 Dacity Coin
 streamoors
 astronaut
 Injective
 Celestia
 Pudgy Penguins
 Sui
Sui
- Funding Circle’s stock price has experienced some bullish momentum as it bounced off its immediate support.
- The Stock price is looking to go up. See where to place a trade.
- MACD and RSI are on the verge of a crossover with their moving averages. See whether bullish or bearish.
Funding Circle’s stock started rising back in September 2022. The company’s earnings report was published in early September. It revealed a 36% downfall in revenue growth.
However, the market flowed with a bullish sentiment for a short while. That helped the FCH stock price go up and break multiple resistances. The bulls took their rally from £36.3 in September to a whooping high of £70 in early February 2023.
The market had some corrections after the bullish rally. The stock price went into a consolidation mode with floor and cap of £50 and £60. This sideways market stayed the same until July 2023. The stock broke its major support and fell.
Technical Analysis and Prediction of FCH Stock Price
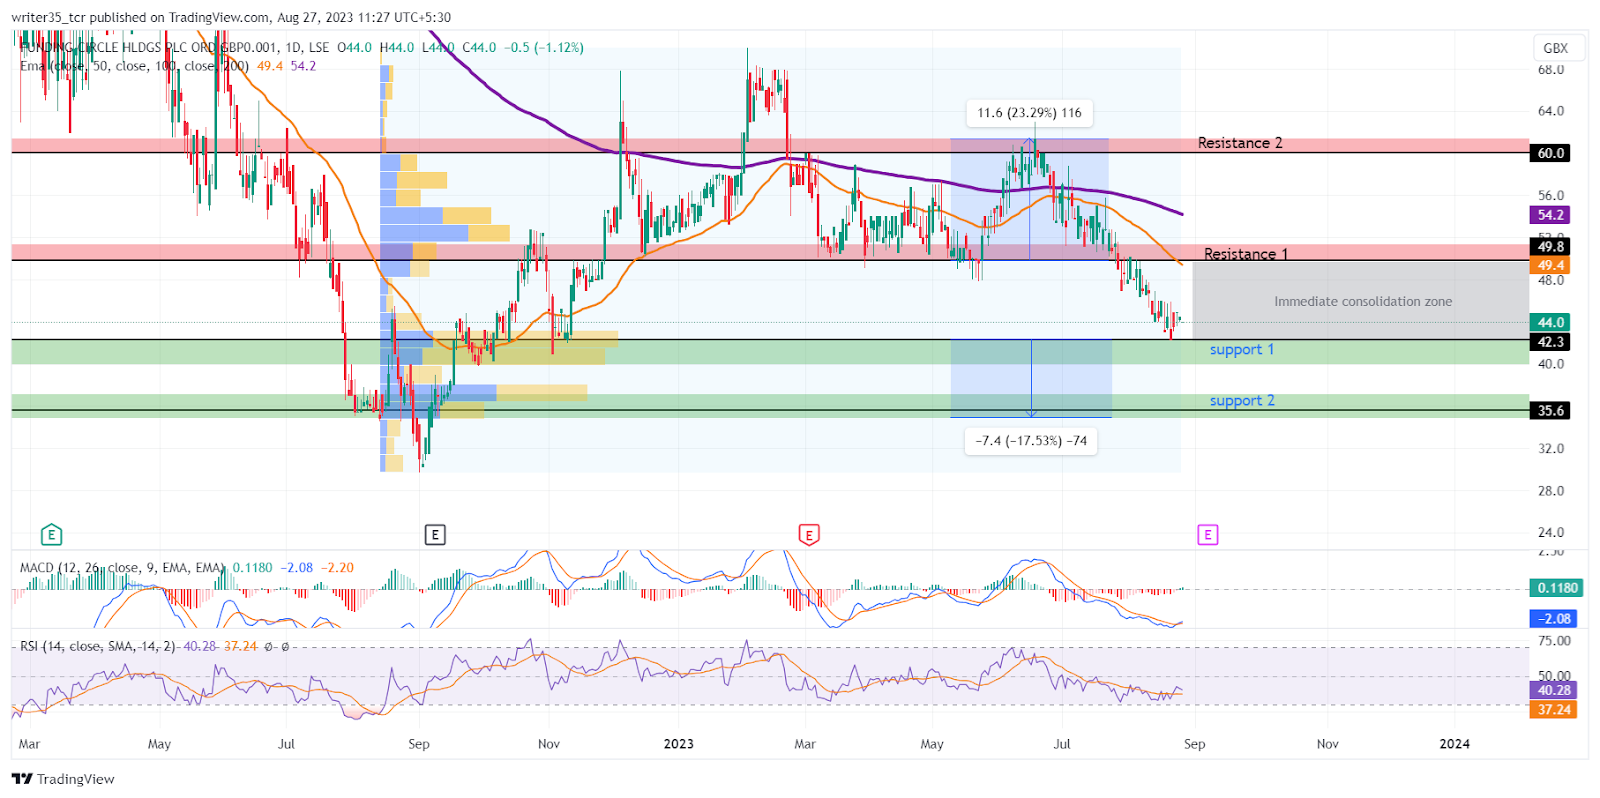
The FCH stock price is currently breaking a major support of £49.8. The bearish momentum has been there since the end days of July. The stock has bounced off from its immediate support level of £42.3. A second support awaits at the level of £35.6.
Above the support levels, The resistances have occurred on the levels of £49.8 for the immediate one and £60.0 for the second supply zone.
What are the Indicators Showing?
Between the support and the resistance, indicators display some exciting insights for the short-term momentum. The RSI graph has seen a downward trend after the RSI line touched its overbought level of 70 back in June this year. The RSI is at 40 and its SMA is at the level of 37. They have made a bullish crossover after FCH stock bounced off its support.
The MACD on the other hand is showing somewhat similar momentum as the RSI. The MACD line and its EMA did a bearish crossover back in the end days of June 2023. Both lines are currently below the neutral level of the MACD graph. The MACD line is at -2.08 while its EMA is at -2.20. A bullish crossover may occur soon.
Moreover, The EMAs are both above the current price level. The 50 EMA is at the level of £49.4. It is close to the immediate resistance. On the other hand, the 200 EMA is above at £54.2.
What is the Price Prediction for FCH stock?
Looking at the present condition, the price prediction for the FCH graph is bullish in the short term. Since the stock has bounced off its support with the MACD and RSI on the verge of a sustainable bullish crossover. A buy can be made with a target of £49.4 and a stop loss at £40.0
Technical Levels
Support: £42.3, £35.6
Resistance: £49.8, £60.0
Disclaimer
The views and opinions stated by the author, or any people named in this article, are for informational purposes only. They do not establish financial, investment, or other advice. Investing in or trading crypto assets comes with a risk of financial loss.



