
 Dacity Coin
 Celestia
 Pudgy Penguins
 Injective
 Solana
 Sui
Sui Starknet
- VTU stock financial highlights and statement analysis.
- The company’s share price reflects its strong financials because the stock is in a constant uptrend.
- The VTU stock is near its support while the RSI has indicated a possible trend reversal.
Vertu Motors PLC is an Automobile company that deals in the retailer segment in the United Kingdom. The company offers New and Used cars, auto parts, and accessories. It also provides services like auto repairs, maintenance, booking an MOT, priority service plan, seasonal offers, accident, and repairs, etc.
Robert Forrester is leading the company as the CEO. Karen Anderson is the CFO of the company. It has an employee size of over 7,000. Vertu Motors’ major shareholders are Robert Forrester (2.1%) and William Dobie (2.06%).
Financial Analysis of VTU Stock
Here is a brief financial analysis of annual reports. First, we will assess the Income statement and then we will take a look at some price and profitability ratios. We will later move to the balance sheet and cash flow analysis of the company.
- Income statement:
The company has posted a revenue of £4.01 Billion in 2022. It was 11% more than the revenue reported in 2021. Since this firm is in the capital-intensive industry, the gross profit came down to £417 Million. The gross margin is just 10.3%.
The company only got £40.97 Million after deducting the operating margin of 1.02%. It is further reduced to a net income of £25 Million after paying taxes and some non-operating expenses.
- EPS:
Vertu Motors pays Earnings per share of only £0.07 due to a small margin of net share. That sets up the price-to-earnings value of 8.68. The return on equity for the company came to 7.5%. That has been pretty stable in past years.
- Dividend:
The stock is giving regular dividends, with a yield of 3% on average. Vertu Motors PLC’s net margin is less than 1%. The company still maintains a dividend payout of more than 20%!
The Balance Sheet and Cash Flow Statement
Looking at the assets side of the balance sheet, the company has maintained cash balances and short-term investments. This firm’s inventory is pretty stable, indicating a good Inventory turnover ratio of 6.26.
Vertu Motors PLC’s Investments in property plants and equipment are constantly increasing. It indicates that the company is doing some expansion. The liabilities side is showing a huge ‘creditors’ amount. It has decreased the quick ratio to 0.21 despite the availability of cash and investments.
Furthermore, on the long-term liabilities side, the Debt section is growing. It is not a concern for the company because it has the necessary cash reserves. The debt-to-equity ratio of 0.70 is also low.
The company’s cash flow statement is looking stable and full of cash. Vertu Motors PLC is generating regular positive cash flow from its operations. It is investing majorly in acquiring other small businesses and they can bring more profit.
The company has a healthy CFO-to-sales ratio of 20.15%. It has maintained a healthy net cash flow of around 55 Million on average for the past three years. It is helping in piling up immense cash reserves, as shown in the balance sheet.
The figures and the KPIs are calculated by the annual reports provided by Trading View & Yahoo Finance
Technical Analysis of VTU Stock.
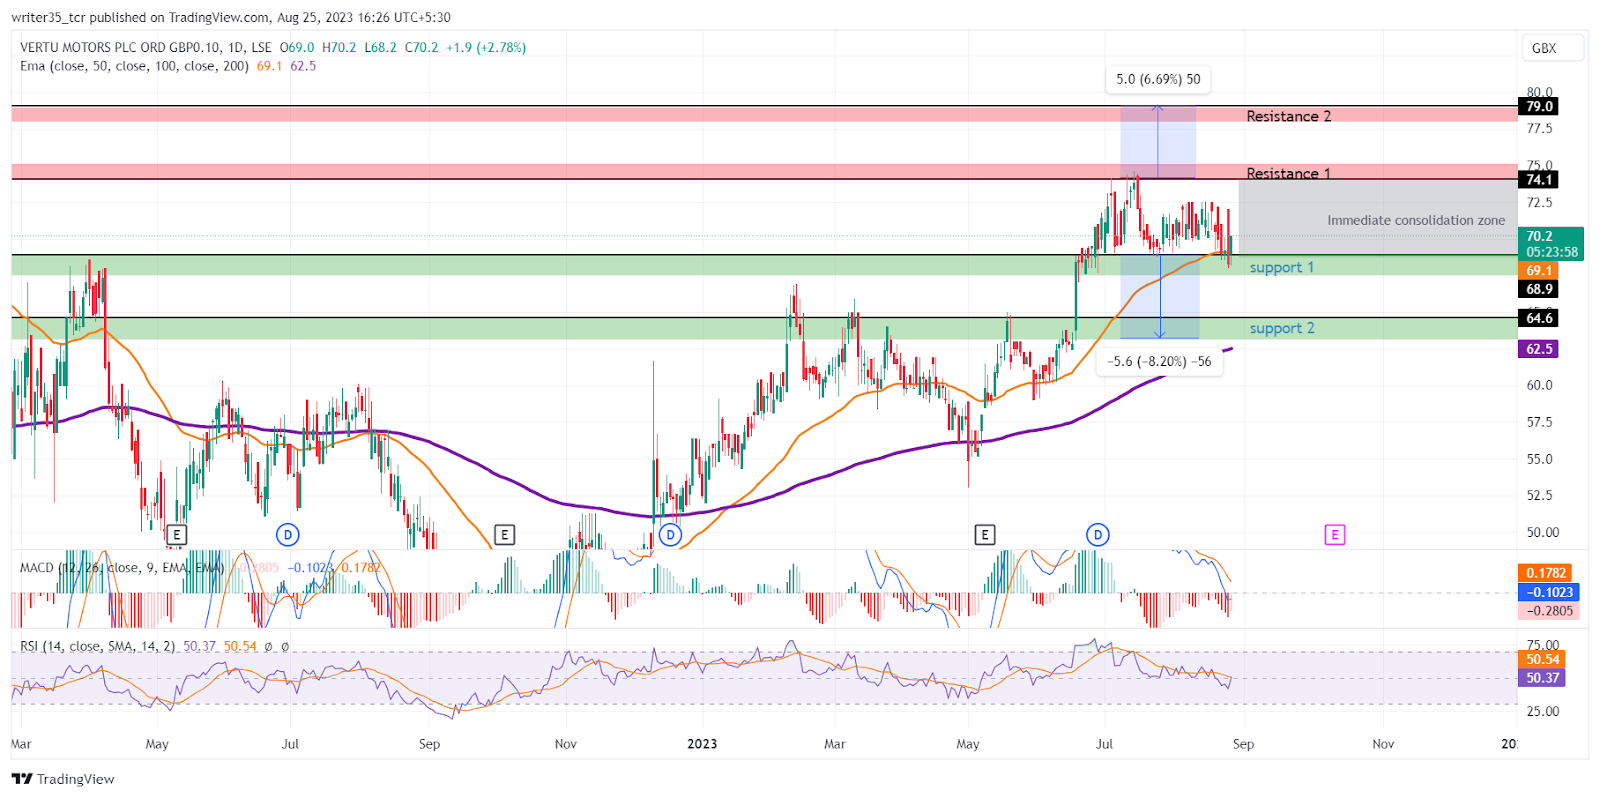
At present, the stock has risen above breaking 2 of its main supports and they are now its supports. The VTU stock is trading at the level of £69.3 while we are creating this post. This level is just above its immediate support level of £68.9.
Meanwhile, the second support level is 8.2% below £64.6. It was an essential resistance broken by the bulls. The volume levels are strong on that level.
After the support at the bottom, the immediate resistance for the stock is at the level of £74. As the stock is near its 5-year high, The second resistance is made 6.69% above at £79.0. This level was drawn on the candles back in 2016.
What Do Indicators Signal?
After the supports and resistances, the indicators have some interesting insights for the near future. The RSI line touched its overbought level of 70. The RSI graph indicates a bearish trend.
That occurred due to a previous bearish crossover between the RSI line and its SMA at the start of July this year. The same trend continues now because the RSI line is at 47 while its SMA is at 50.
On the other hand, the MACD graph shows something similar to the RSI graph. A bearish trend is visible here after the crossover of The MACD line with its EMA. The MACD line is down below the neutral zone at -0.11. Its SMA is up at 0.17
Watching the exponential moving averages, The 50 EMA and the 200 EMA have done a bullish crossover earlier this year. The VTU stock price frequently took support from its 50 EMA. That kept the stock on the uprend.
The stock is again on the verge of taking support from its 50 EMA. It is at the level of £69. Meanwhile, the 200 EMA is down below £62, showing no interest in interaction with the current price action
Is it worth buying VTU stock?
The company seems financially stable from an investor’s point of view. It is investing in necessary areas for growth. It also gives regular dividends. However, some profitability ratios, such as return on equity aren’t up to the mark because of low net profit ratios. A long-term investment in this company could be a wise decision.
Traders can try short-term trades if the stock bounces off its immediate support. That may happen as the RSI has recently shown a spike in strength. If the bears take over, the stock may fall below its 2nd support of £64.6.
Technical levels
Support: £1,713, £1,642
Resistance: £1,772, £1,858
Disclaimer
The views and opinions stated by the author, or any people named in this article, are for informational purposes only. They do not establish financial, investment, or other advice. Investing in or trading crypto assets comes with a risk of financial loss.




