
 Quack AI
 NEAR Protocol
 Pudgy Penguins
 Pearl
Pearl Quant
Quant Quantus
 Sui
Sui
- The stock has been dominated by sellers this entire year giving a negative 15% return till date.
- The current setup looks weak but £1.33 stands as a highly strong support.
- Sellers can still be seen over powering buyers and the next few days will be highly crucial.
Greencoat UK Wind PLC is serving as a renewable infrastructure fund. It invests money in wind farm assets. It also offers exposure to UK wind generation through a premium listed vehicle. The firm was established in 2009 and its headquarters are located in London, UK.
Stable financials, a healthy growth in profit, and revenue generation allures investors.
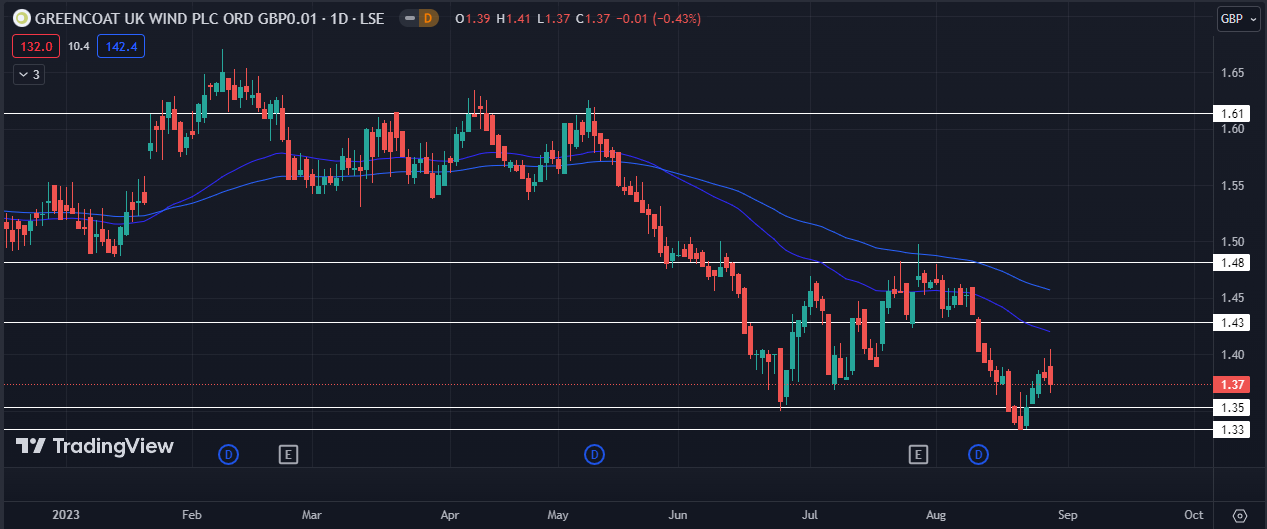
Technical analysis for the stock
The stock has seen a very strong bearish movement after being range bound for a long time. Greencoat stock has recently created its yearly low at around £1.33 levels, but saw a sharp recovery from there. Greencoat stock experienced a little growth but sellers are still dominating the market.
The stock formed a bearish Doji followed by an even stronger Bearish candle on its daily chart. It indicates a confused market.
£1.33 has been a strong support. Thus, more bearish movement may not occur as long as the stock trades above the support level. Buyers yet look weak and confused because of which we are unable to see an up move. More sideways movement for a few weeks is expected before the stock makes a big move.
A good buying zone can only be above £1.48 since it is a strong zone. The rejection may occur at any level.
The current supports for the stock are £1.35 and £1.33. Both of these are highly strong demand zones for the stock. Thus, it is less likely that the stock will breach those supports in near future and go below them.
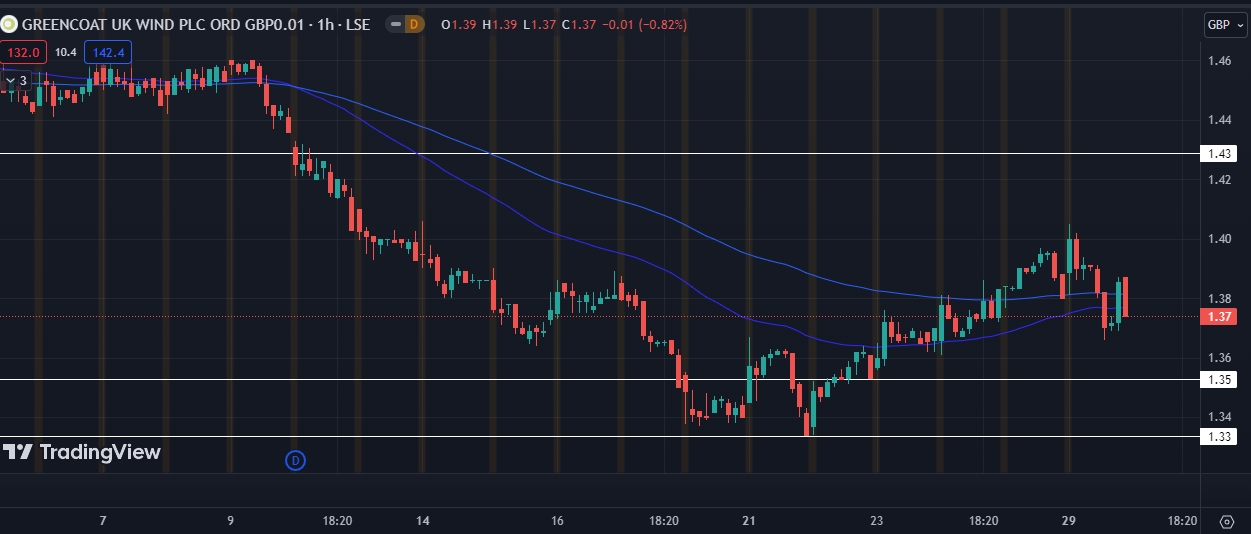
An hourly chart shows the stock in a recovery mode after hitting its yearly lows. The setup looked good until strong sellers entered and stopping the upside momentum in the stock.
£1.35 is still the level to watch carefully. Any level above £1.35 is safe for the stock. If we see a healthy up move from the current levels, £1.40 can be a good entry for a swing trade with £1.43 and £1.48 as the targets. This advice is purely based on the current setup.
Conclusion
The stock has seen a huge selling in the past few months. Now, the sellers are looking to exit. Current levels look strong. Thus, a downside move from here is less likely to occur. More sideways movement may take place because buyers still look somewhat confused.
Important technical levels
- Major support levels: 1.35£ followed by 1.33£.
- Major resistance levels: 1.43£ followed by 1.48£.




