
 Injective
 Bitcoin
 Quantus
 Sui
Sui Derive
 Pump.fun
 Quant
Quant
- The wounds of 2009 are healing as the stock has been on an uptrend since the end of 2020.
- The bulls are fighting to get over its 50 EMA. Know the price prediction.
- The price is near its 200 EMA, and it remains to be seen whether it will take support from this level.
After suffering one of the biggest bank robberies back in 2009, The Bank of Ireland’s stock price took a massive hit and fell from trading at €352 to €11.7. However, since 2020, the investors seem to be interested once again in BIRG stock. The factors behind this could be its somewhat consistent profitability and dividends.
Technical Analysis and Price Prediction
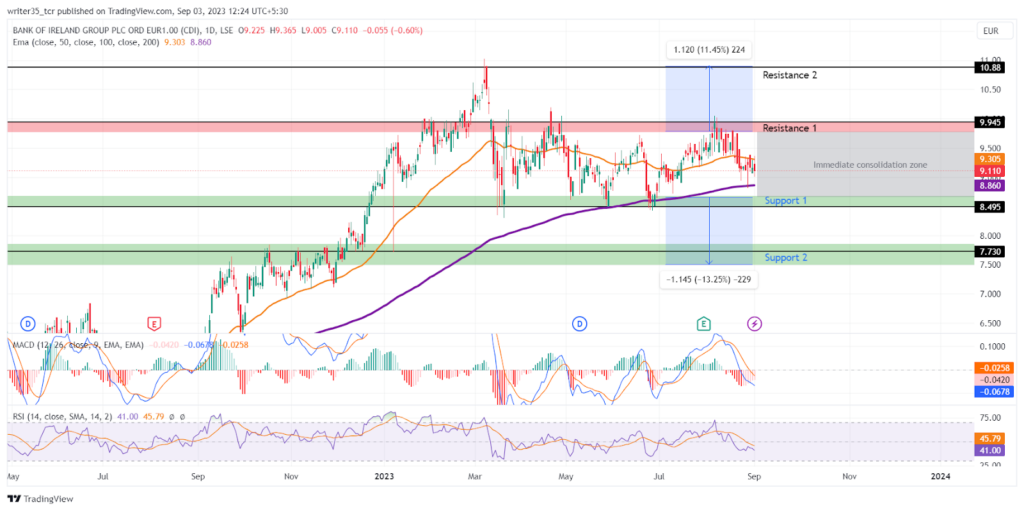
BIRG stock price started rising after making a low of €1.50 in September 2020. The stock price has been in a continuous uptrend since then. The bulls made a high of €10.34 in March this year. Since then, the stock has been seen in a consolidation mode, swinging between its immediate supports and resistances.
Following a rejection at the €9.94 resistance level, BIRG stock is currently experiencing a bearish trend. It is expected to test its immediate support level at €8.49 before potentially rebounding. Additional support and resistance levels are located at €7.73 and €10.88, respectively.
What are the indicators showing?
The BIRG stock price is currently navigating between support and resistance levels, with several key indicators playing a role. Notably, the price has been above its 200-day Exponential Moving Average (EMA) since the uptrend began in 2020, providing a strong support level of around €8.86. However, the bulls are struggling to overcome the 50-day EMA, located at €9.305, as they face continuous rejections.
In terms of momentum indicators, the MACD line has been showing a bearish trend since encountering resistance. A bearish crossover occurred in August, and the MACD and its EMA currently stand at -0.0678 and -0.0258, respectively.
Similarly, the relative strength index (RSI) has displayed a bearish sentiment, with both the RSI line and its SMA experiencing a bearish crossover a few days prior to the MACD. The RSI is currently at 41, indicating a downtrend, while its SMA is at 45.7. These indicators suggest a bearish sentiment in the market for BIRG stock.
Is it worth buying BIRG stock?
The price prediction for BIRG stock hinges on several key factors. A bullish scenario is possible if the bulls manage to bounce off the 200-day EMA, as they have successfully done over the past two years. The 200 EMA serves as a critical support level, and maintaining this level could sustain the uptrend.
Conversely, if the bulls are unable to overcome the resistance posed by the 50-day EMA, the situation may take a bearish turn. If the stock price falls below €8.49, it could potentially head towards its second support level at €7.73. The outcome will likely depend on how well the stock can hold key support levels and whether the bulls can regain momentum in the face of resistance.
Technical Levels
Support:€8.49, €7.73
Resistance: €9.94, €10.88
Disclaimer
The views and opinions stated by the author, or any people named in this article, are for informational purposes only. They do not establish financial, investment, or other advice. Investing in or trading crypto assets comes with a risk of financial loss.




