
 Boomer
 Covenant x402
 Pearl
Pearl Claudia
 Solana
 Bitcoin
 Quantus
- The NYCT price is trading at 72.4 GBX.
- The price has recently given the breakout of the parallel channel it was trading in.
Novacyt Group (LSE: NCYT) is an Anglo-French Biotechnology group. That was founded on 3 July 2006 by Eric Peltier, Gerald Ulrich, and Jean-Pierre Crinelli. The company deals in the development and sales of infectious disease diagnostic products.
Novacyt (NCYT) Stock: Financial Analysis
Novacyt’s financial performance has been very volatile in recent years. In 2020, the company’s revenue increased significantly due to the COVID-19 pandemic. However, as the pandemic receded the company’s revenue fell in 2021 and 2022.
Additionally, the company’s net income has been also negative in recent years. The company has decreased its total debts over the years. The company’s total operating expenses have been very high in 2022
The company’s finances have not been that strong and have been very volatile over the recent years. The company is trying to revive its financial performance by decreasing its debt ratio in recent years.
Novacyt (NCYT) Stock: Technical Analysis
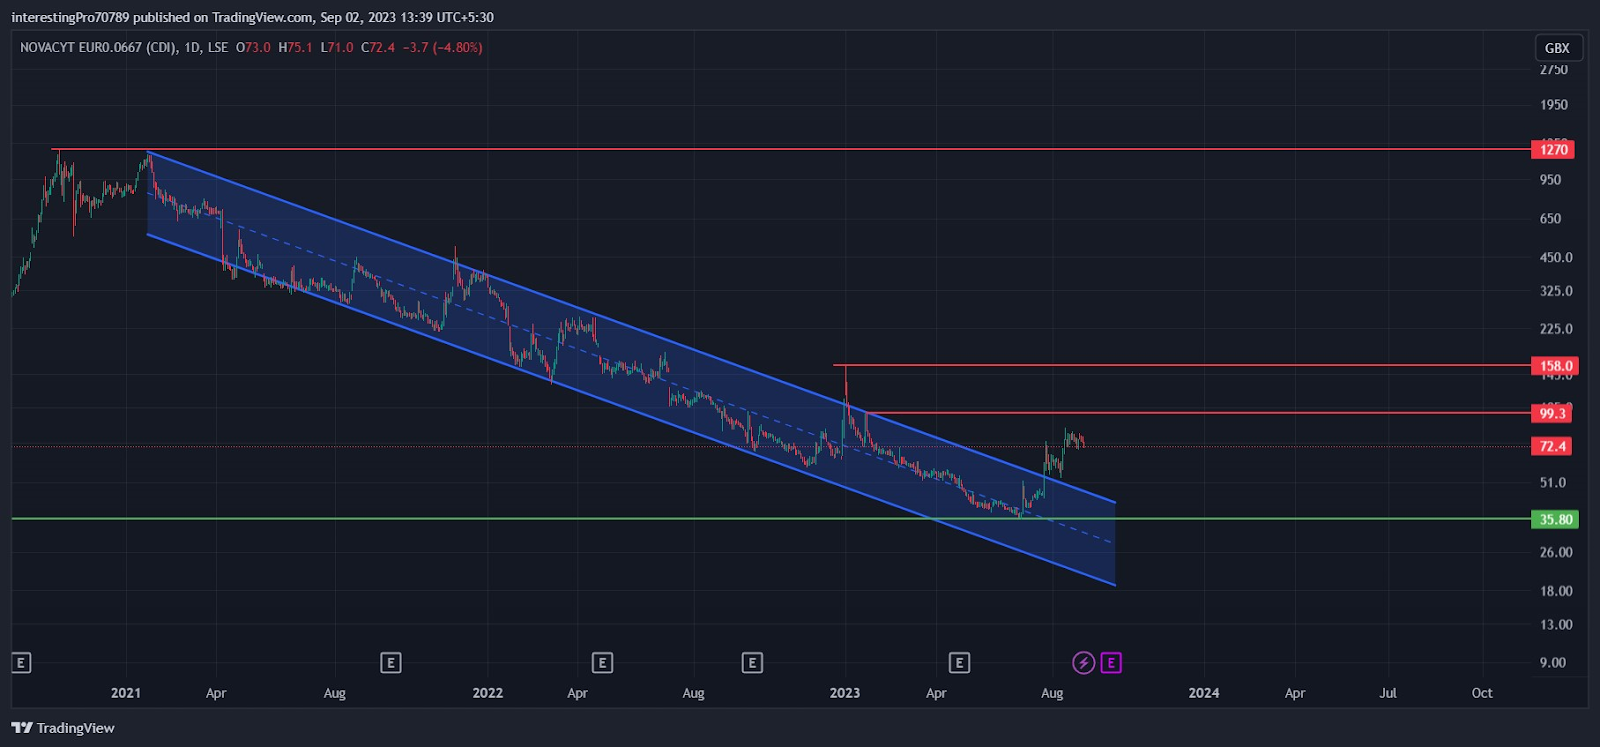
The company stock price has been in a downtrend since the start of 2021 after the price faced rejection from the all-time high of 1270 GBX. The stock price was seen trading. Inside a parallel channel for more than two years.
In January 2023, the stock price tried to give the breakout of the parallel channel but faced immediate rejection from 156.4 GBX. The breakout was turned into a fakeout due to which the price was seen falling. And went back to the parallel channel again.
In June 2023, the stock price took support from its historical support at 35.80 GBX. After taking support the price commenced a bullish rally and gave the breakout of the parallel channel.
The price was seen rising in the upward direction in the higher high formation. Currently, the price is trading just below the 99 GBX resistance. If the price gives a breakout of the 99 GBX resistance then the price could be seen rising to 158 GBX. Which will act as the next resistance for the price.
However, the price failed to close above the 99 GBX resistance and faced rejection from there then the price could be seen falling to its support at 35.80 GBX. The price could be seen trading inside the range of 99 GBX to 35.80 GBX. Till the price gives the breakout of 99 GBX resistance.
Technical Indicators’ Prediction About the Current Trend
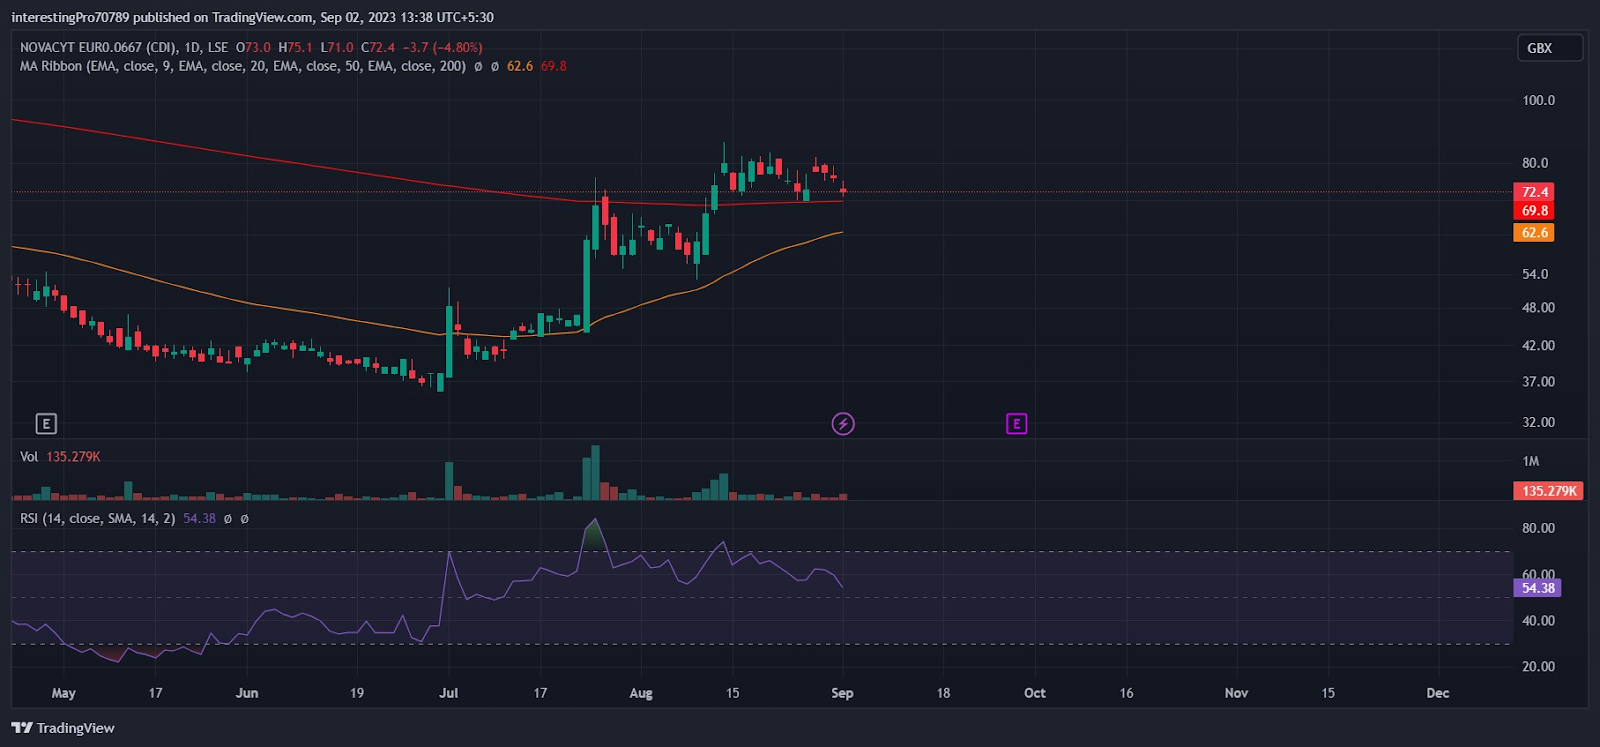
The 50-ema line (yellow line) is at 62.6 GBX and the 200-ema line (red line) is at 69.8 GBX. The price is currently trading above the 50 and 200 ema and both ema lines are close to each other. This indicates the price is in bullish sentiment at the time of writing. If a golden crossover could be seen in the future where 50 ema will intersect the 200 ema from the downside to the upside. A good upside move can be seen in the future.
The relative strength index is at 54.38. The RSI line is in neutral territory indicating the NCYT Stock price is in the indecisive state. As it is getting pressurized from buyers as well as sellers.
Conclusion
The NCYT Stock price is bullish for now. The price has taken support from its historical support at 35.80 GBX and has given the breakout of the parallel channel. If the price gives the breakout of 99 GBX resistance. Then the price could be seen moving in the upward direction to its next resistance.
However, if the NCYT Stock price faced rejection from the 99 GBX resistance. Then the price could be seen trading in a range of 99.3 GBX to 35.80 GBX.
Technical levels
Resistance levels: 99 GBX and 158 GBX.
Support levels: 25.80 GBX.
Disclaimer
The views and opinions stated by the author, or any people named in this article, are for informational purposes only. They do not establish financial, investment, or other advice. Investing in or trading crypto assets comes with a risk of financial loss.




