
 astronaut
 Walrus
 Pearl
Pearl Bitcoin
 NEAR Protocol
 Zcash
Zcash Hyperliquid
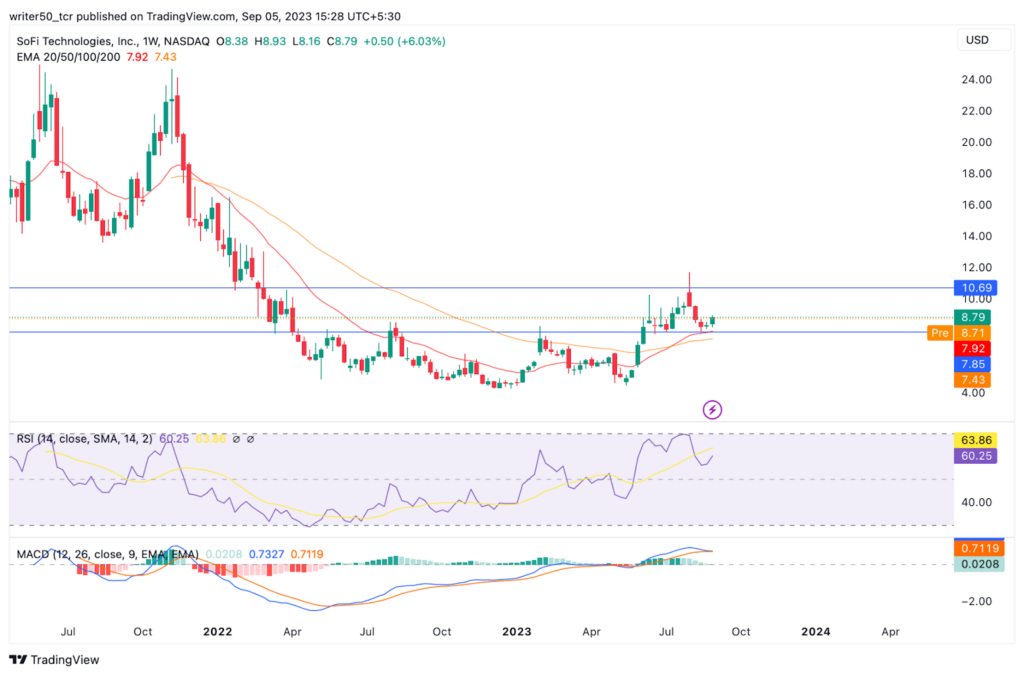
- SoFi Technologies Inc.’s stock price is above the 50-day and 100-day EMA levels.
- The current market price of SoFi Technologies is $8.79.
- The market cap of SOFI stock is $8.3 Billion.
SoFi Technologies (NASDAQ: SOFI) stock is now moving upwards. In the weekly timeframe, the price of the SOFI stock is making higher highs.
The SOFI stock has a market capital of $8.3 billion and the revenue of the stock is $1.76 Billion. The stock has hit the 52-week high of $9.16 adn the 52-week low of $20.23.
The stock price of SOFI has made a all time high of $10.23 on 14 June 2023, and after this the price has fallen by almost 25% in just nine days.
However, the price of SOFI stock found support at $7.79 and the price rebounded from here. From this point the stock has shown a recovery of almost 30%. In one year SOFI stock has grown by 47.3%.
The SOFI stock price is showing a bullish trend in the present market situation. The price has made an all-time high. The price is forming a strong structure and it is expected to see new highs in the upcoming days.
The revenue of SOFI stock rose from $171.59 Million to $472.54 Million.
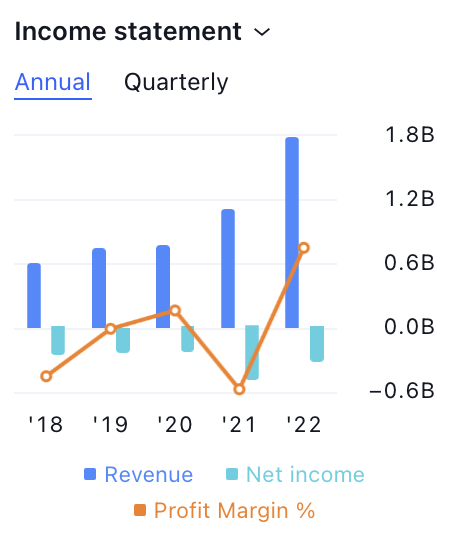
As per the income statement of the SOFI stock. The profit margin of the stock is increasing with respect to the revenue.
The earning of the SOFI stock is also rising. The actual earnings are greater than the estimated earnings. This indicates that the stock is in upward momentum and the overall finances of the company are strong.
SoFi Technologies Inc. (SOFI) Stock Price Analysis
EMA
The SOFI stock is currently trading above the 50-day and 100-day EMA levels in the weekly tiemframe.. This indicates that the price is forming a strong pattern and the price is likely to rise in the future.
MACD
The MACD lines for the SOFI stock are trading above the signal line. This is a strong indication that the price is in upward momentum and the price will see new highs in the future.
RSI
The 14-day SMA line and the RSI line for SOFI stock are close to 70. This is a positive signal. The price is likely to rise.
Conclusion
As per the analysis, SoFi Technologies stock is moving in an upward direction. The price is currently moving in between the range. The earnings of the stock are also rising. The indicators are positive for the SOFI stock.
Therefore, if the stock price breaks above the resistance level, a further upmove is expected in the future.
Technical Levels
- Support Level: $7.85
- Resistance Level: $10.6
Disclaimer
The views and opinions of the author, or anyone named in this article, are for informational purposes only. They do not offer financial, investment, or other advice. Investing or trading crypto assets involves the risk of financial loss.



