
 NEAR Protocol
 Quack AI
 Pearl
Pearl Zcash
Zcash Lighter
 Quantus
 Sui
Sui
- The UU. stock price is trading at 932 GBX.
- The stock is currently trading above the recent low of 914.8 GBX.
Founded on 1 April 1989, The United Utilities Group (LSE: UU) is a water supply company. It deals in the provision of water and wastewater services.
United Utilities (UU.) Stock: Financial Analysis
The company’s revenue has been stable in recent few years. The operating expenses show that the company’s expenses has been less than its earnings. This firm has a good track record of paying dividends to its shareholders. It didn’t pay any dividends for the first in 2021.
The company’s net debts have increased by about 100 Million Euros in 2022 because it paid the repayment of 200 Million bonds and insurance of the 300 Million Euro bond.
Overall, the company is good for those, looking for a reliable dividend payer with a stable fundamental.
United Utilities (UU.) Stock: Technical Analysis
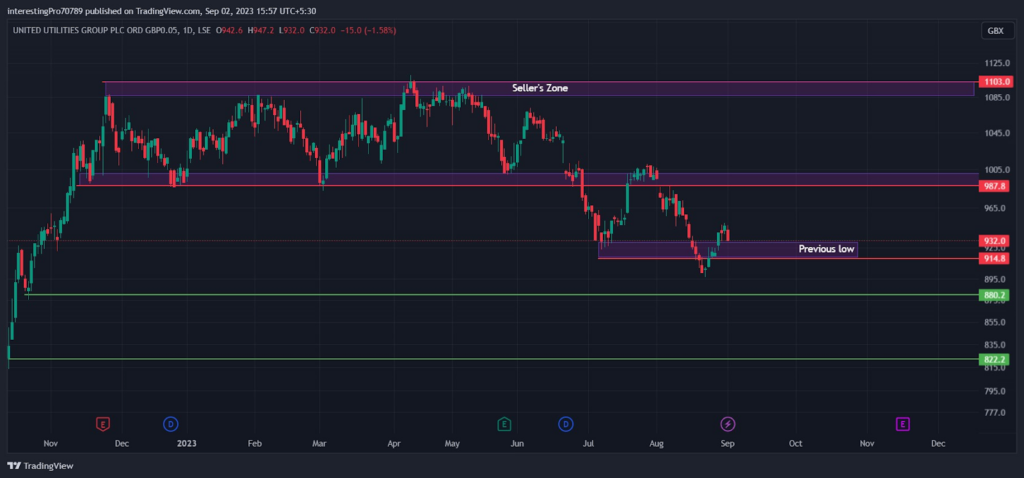
In November 2022, the stock price formed support at 987.8 GBX and commenced a bullish rally from there. The price went up to 11.3 GBX and faced rejection from there. It fell back to its 987.8 GBX support.
In that very month, the price again commenced a bullish rally from the support. That rally stopped at the 1103 GBX resistance. The price was seen trading inside this range for the duration of more than one and a half years.
At the end of June 2023, the price gave the breakdown of the 987.8 GBX support, but it was still falling. It took a pullback and retested the 987.8 GBX support zone. The price again started to fall in the formation of a higher low structure after retesting the support zone. It shows the dominance of sellers.
Recently, the price has given a breakdown of the previous low (914 GBX). It went above the previous low (914 GBX) after giving a pullback. If the price sustains above 914 GBX, it may rise to the 987.8 GBX resistance.
However, if the price breaks below the 987.8 level, it may fall to 880 GBX and then to 822 GBX.
Technical Indicators’ Prediction About the Current Trend
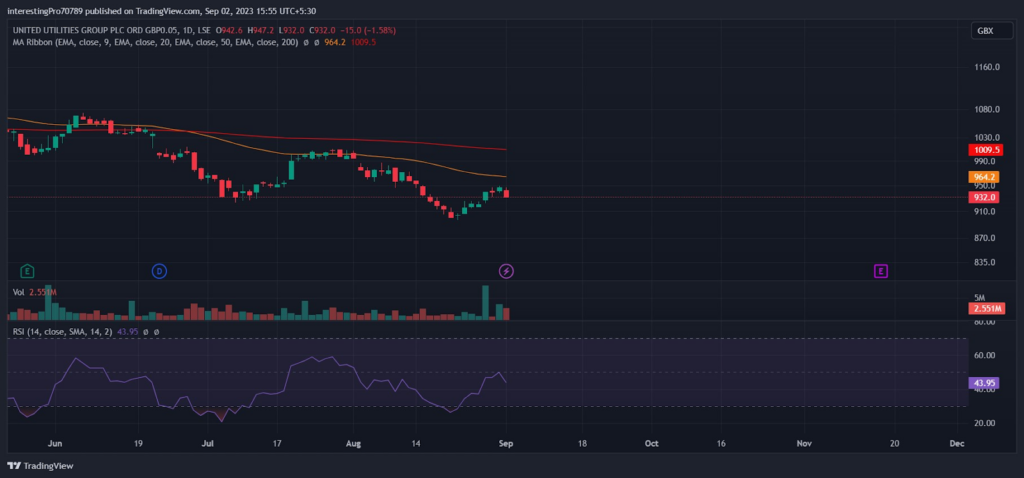
The 50-ema (yellow line) is at 964.2 GBX and the 200-ema (red line) is at 1009.5 GBX. The price is trading below the 50 and 200 ema after the downward crossover of the 50 ema through the 200 ema. That indicates the bearish sentiment of the price.
The relative strength index is at 43.95. The RSI line is in bearish territory and it is facing in the downward direction. It shows the price is in control of bears at the time of writing.
Conclusion
The United Utilities chart is bearish at the time of writing. The price is following a higher low structure. All the indicators mentioned above for the price trend analysis are bearish at the moment.
Technical levels
Resistance levels: 987.8 GBX and
Support levels: 914.8 GBX, 880 GBX and 822 GBX.
Disclaimer
The views and opinions stated by the author, or any people named in this article, are for informational purposes only. They do not establish financial, investment, or other advice. Investing in or trading crypto assets comes with a risk of financial loss.




