
 Quack AI
 NEAR Protocol
 Pearl
Pearl Zcash
Zcash Quant
Quant Pudgy Penguins
 Quantus
- The price of the Paramount Global stock has been declining consistently from the higher levels. It has lost its value by -74.17% in the last 5 years.
- The company works in the Consumer Services sector and the broadcasting industry.
Paramount Global has its headquarters in New York and Robert Marc Bakish is the CEO of the company. The Company was founded in 1986 and has a total of 24.5K employees.
The current EPS of the PARA share is -1.88 USD, which means the company is losing 1.88 USD for each share. The Beta for the share is 2.03, which indicates that the stock price moves relatively more than the whole market. The share has a 52-week range of $13.62 – $25.93.
Paramount Global has paid $0.96 as a dividend per share for the year 2022. The dividend yield by the company is 5.69% and the payout ratio of the company is 59.66%. The average volume for the share is 11.4 Million.
Paramount Global Debt Analysis
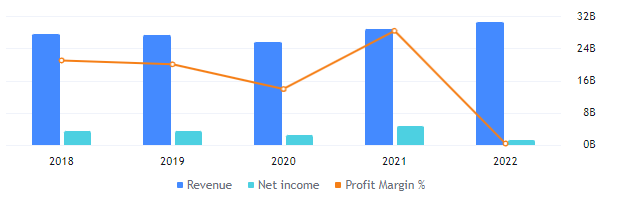
The revenue for the company has been consistently advancing over the last four years. It currently stands at $30.15 Billion for the year 2022. The company made a gross profit of 33% and the Net Income of the company is 4% of the total revenue.
PARA Technologies Technical Analysis
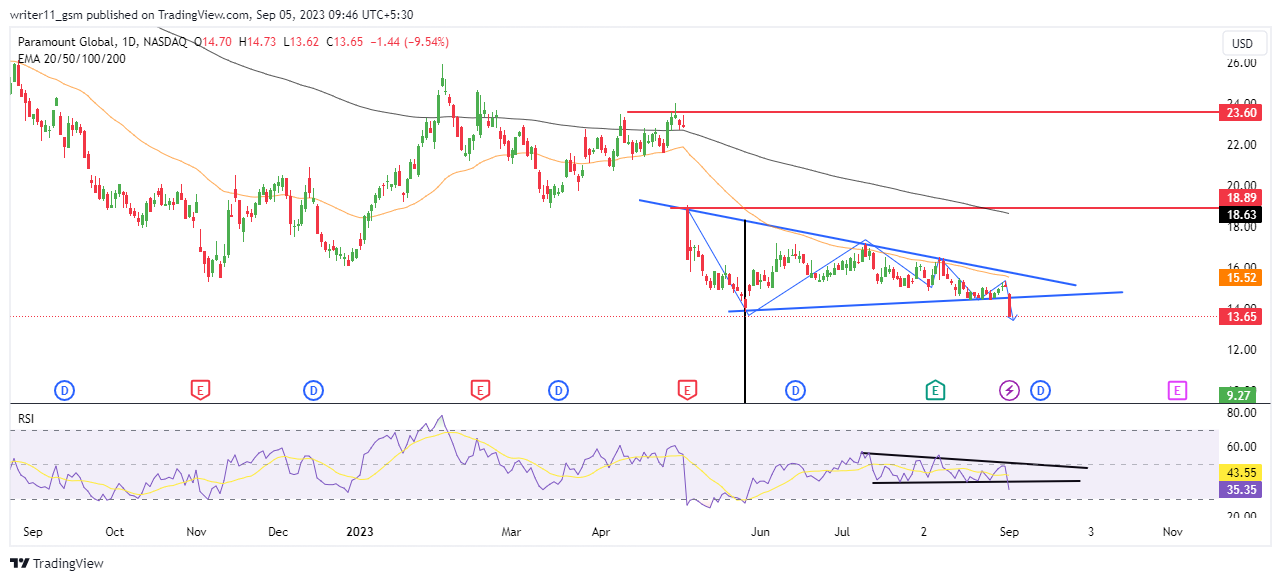
The price of the PARA share has been consistently declining. It has been trading in a bearish trend for a very long time. This decline in price led to the formation of a symmetrical triangle. It represents the sign of sustainability at lower levels but the price further broke down below the pattern.
The price has been following a downtrend in the larger timeframe. Therefore, the EMA’s are acting bearish. The 50-day and the 200-day EMAs are trading in a death cross, and the price is also declining below both the EMA’s.
The RSI of the stock was consolidating near the 50-zone. The price has recently broken down below the symmetric triangle pattern. It resulted in the same scenario in the RSI oscillator.
Technical Overview of PARA Stock
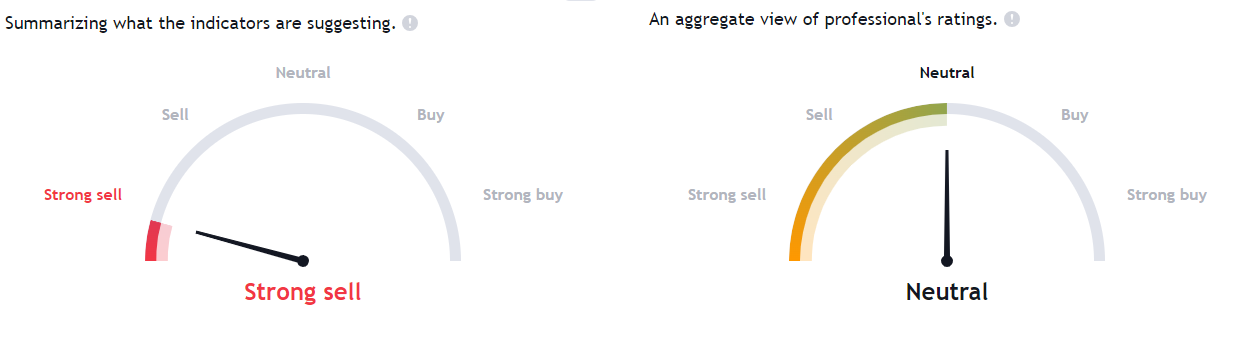
By considering Tradingview’s summary analysis tool, we can see that a majority of the indicators including EMA’s and multiple oscillators, all are bearish for the stock. Professional analysts are neutral on the stock based on the current financials.
Conclusion
The price structure of the Paramount Global share is negative due to a consistent decline in price. The EMA and the RSI are also acting bearish on the charts. The majority of the oscillators are also giving a sell signal.
The market has broken down below the symmetrical triangle pattern. Therefore, we might get to see lower prices of the stock in the future hitting the support levels.
Technical Levels
- The support levels for PARA Stock are – $9.20 and $5.00
- The resistance levels for PARA stock are – $19.00 and $24.00
Disclaimer
The information provided in this article, including the views and opinions expressed by the author or any individuals mentioned, is intended for informational purposes only. It is important to note that the article does not provide financial or investment advice. Investing or trading in cryptocurrency assets carries inherent risks and can result in financial loss.




