
 Dacity Coin
 Pump.fun
 Pudgy Penguins
 Bitcoin
 Pearl
Pearl Monad
Monad Zcash
Zcash
- The SNDL share price is on the verge of breaking out above the crucial resistance.
- SNDL has an EPS of -0.91 USD, which means that the company is losing money on each share.
The company has a market value of $494.494 Million and a beta of 1.63. It indicates that the stock fluctuates more than the market as a whole. The company also has 260.26 Million floating shares, which can be traded in the stock market.
The company started in 2006 and works in the process industries sector. The share has a negative ROE of -18.05%. It shows that the company is losing the money! This stock’s ROA is also negative, which indicates the is failing to use its assets and resources efficiently. The company has a moderate debt/equity ratio of 22.11%, which indicates the company has a reasonable level of debt compared to its equity.
The company has a gross profit margin of 0.19, but a net profit margin of -0.53. It means the company is not very profitable. The company’s market value has increased by +359.5% compared to the previous year. It reflects the rise in the stock price.
SNDL Inc. Company Performance Analysis
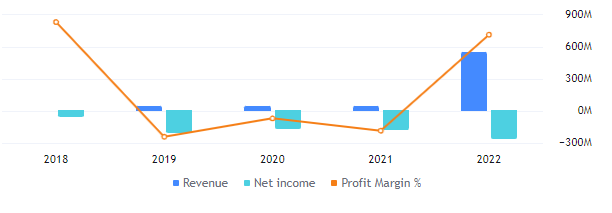
SNDL Inc. earned a total of $547.06 Million in revenue in 2022 and had a gross profit margin of 14%. The company’s net income dropped by 76 Million USD, which could hurt its future expansion plans.
SNDL Technologies Technical Analysis
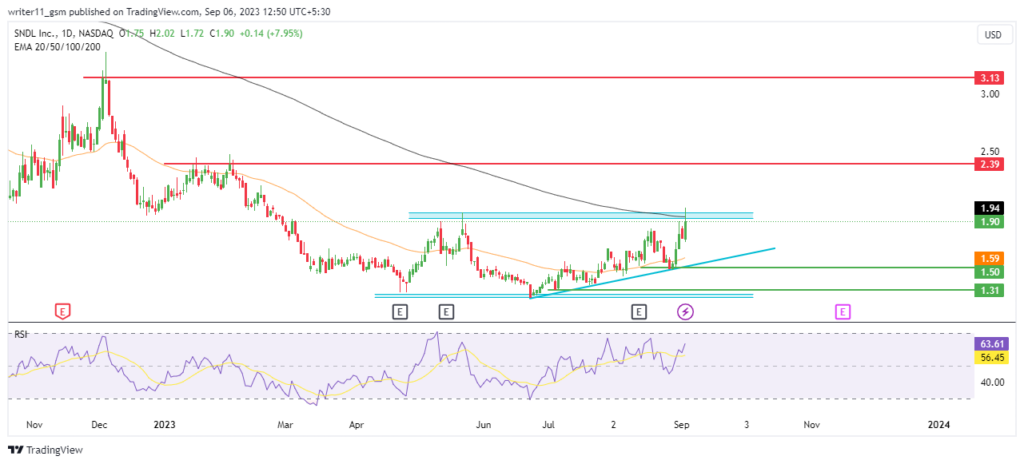
The SNDL share’s price is trading inside a zone sustaining above a dynamic trendline. If the price manages to break above the zone and sustains there, it can advance to a higher level.
Due to a consistent decline in the market value, a death cross of the 50-day and the 200-day Exponential Moving Average has been formed. The market has been following the same declining to lower levels. The price is on the verge of breaking above the 200-day EMA. It might further lead to a change in the trend.
The value of the RSI is trading above the 50-level and has sustained above the same for a very long time. It has also crossed above the 14-day SMA line, which indicates bullishness on the charts.
Technical Overview of SNDL Stock
The SNDL company earned a total of $547.06 Million in revenue in 2022 and had a gross profit margin of 14%. The company’s net income dropped by a huge amount of 76 Million USD, which could hurt its future expansion.
Conclusion
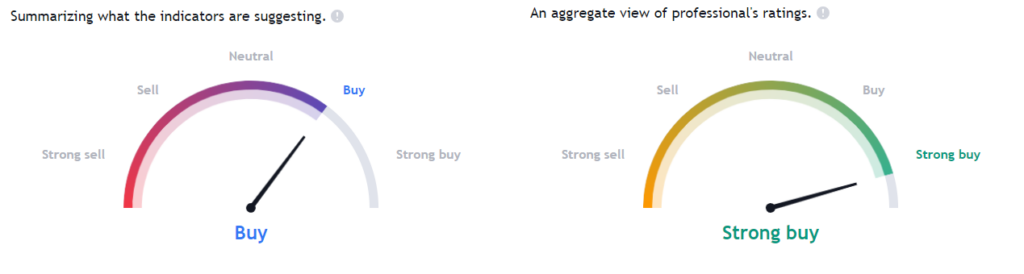
The SNDL share price was in a downtrend for a very long time. It has recently started to sustain at the lower levels. It is currently advancing by making a higher high pattern. If the price breaks above the 200-day EMA, then we can get to see higher levels in the stock. The RSI is also bullish on the charts and a majority of the technical indicators are the buy signal.
Technical Levels
- The support levels for SNDL Stock are – $1.25 and $1.50
- The resistance levels for SNDL stock are – $2.40 and $3.10
Disclaimer
The information provided in this article, including the views and opinions expressed by the author or any individuals mentioned, is intended for informational purposes only. It is important to note that the article does not provide financial or investment advice. Investing or trading in cryptocurrency assets carries inherent risks and can result in financial loss.




