
 Dacity Coin
 Celestia
 Quantus
 Bitcoin
 Pearl
Pearl Pons
Pons Injective
- The share price of Lyft Inc. has been advancing from the lower levels in very recent times. The price of the stock has increased by +15.40% during the last seven days.
- The company does not pay any dividends to its investors.
LYFT Inc has 377.635 million shares floating in the market and the beta of the stock is 2.31. It indicates that the share generally moves higher than than market as a whole. The LYFT stock seems more volatile than the overall market.
Lyft has a negative ROE of -251.69% and the operating margin is also negative at -15.53%. The company’s gross margin is 31.30%, but the stock has a negative EPS of -$3.57. It means the company is making losses.
The company was founded in the year 2007 and has a total of 4.419K employees. John David Risher is the CEO of the company and the company works in the Transportation sector.
Lyft Inc. Performance Analysis
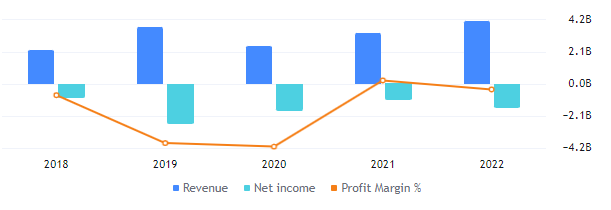
The LYFT stock has made a total revenue of $4.10 Billion in 2022 and the gross profit of the company stands at 30%. The net income of the company has slightly declined by $0.56 Billion as compared to 2022. This company’s current profit margin is -38.69%.
LYFT Technologies Technical Analysis
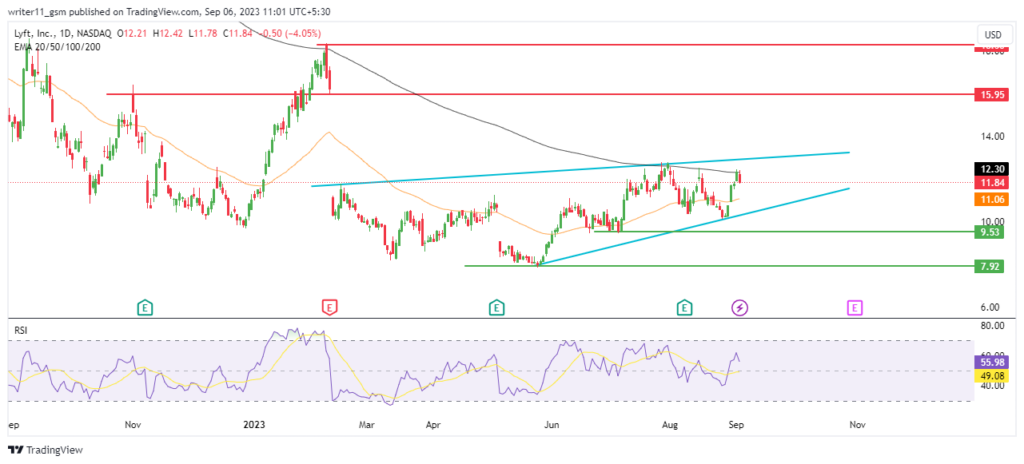
After a huge decline, the Lyft share price is trying to rebound in the lower timeframe by making a double bottom. It has created a rising wedge pattern and is still trading inside the same. If the price breaks above the pattern, it can lead to a huge upmove.
Due to a consistent decline in price in the higher timeframe, the 50-day and the 200-day EMAs are trading in a death cross following a preceding downtrend indicating for a bearish signal.
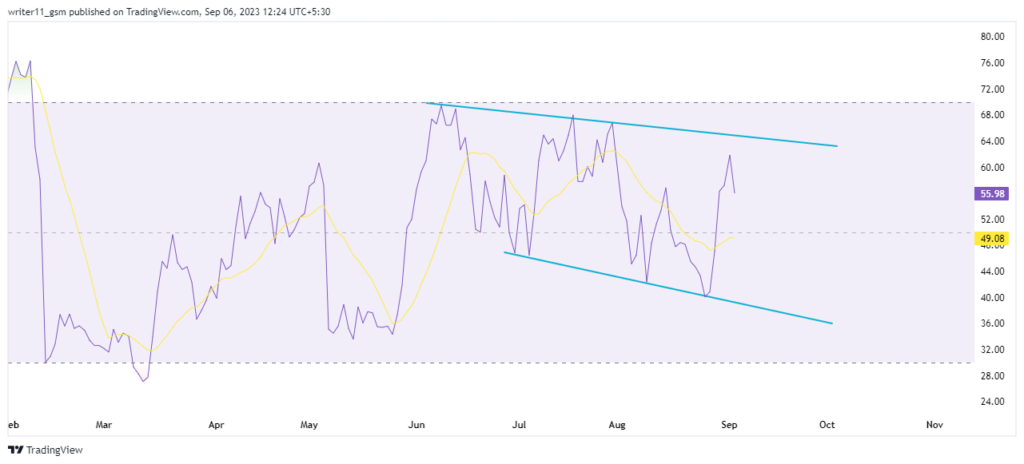
The RSI of the LYFT share is also uncertain. It has formed a declining wedge pattern. If the RSI value breaks above the pattern, the uptrend will get one more confirmation. Thus, the price will continue to advance consistently.
Technical Overview of LYFT Stock
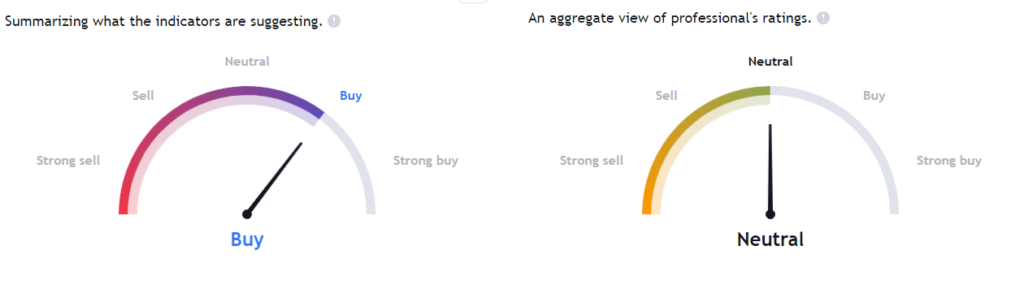
The summary analysis tool from Tradingview shows that most of the indicators such as EMA’s and various oscillators are positive for the stock. However, professional analysts have a balanced view on the stock because of its fundamental data.
Conclusion
In the shorter timeframe, the price structure of the LYFT share has become bullish. The price is advancing from the lower levels, leading to the formation of a rising wedge pattern. Technical indicators such as RSI and EMA are uncertain at the moment because the market is trading in an advancing channel.
Therefore, we must wait for the market to break above the rising wedge pattern. The breakout will activate the buyers sentiment.
Technical Levels
- The support levels for LYFT Stock are – $7.90 and $9.50
- The resistance levels for LYFT stock are – $16.00 and $18.30
Disclaimer
The information provided in this article, including the views and opinions expressed by the author or any individuals mentioned, is intended for informational purposes only. It is important to note that the article does not provide financial or investment advice. Investing or trading in cryptocurrency assets carries inherent risks and can result in financial loss.




