
 Zerebro
 Bitcoin
 Quantus
 Pearl
Pearl Starknet
 ZKsync
 NEAR Protocol
- Cosmos price declined by 27.7% in three months.
- The Cosmos coin has a circulating supply of 363.1 Million.
- Cosmos (ATOM) has a market cap of $2.4 Billion.
Cosmos (ATOM) coin is trading in a downward momentum. The price of ATOM is forming a lower-low pattern. The price of the ATOM coin is creating a strong bearish pattern.
Financial Data of Cosmos (ATOM)

The market capital of ATOM is $2.477 Billion. Currently, the ATOM is trading at $6.8, with a fall of 1.02% on 7 September 2023. The coin has a total circulating supply of 363.24 Billion.
The Open Interest of the Cosmos coin is $67.7 Million. The OI of ATOM has declined by around 0.87% in the last 24 hours. This indicates that the sellers are active in ATOM.
The ATOM has an average trading volume of $85.5 Million. The fully diluted valuation of the ATOM coin is $2.4. Billion. The coin has declined by over 84.7% after hitting a high of $44.7 on September 20, 2021.
The ATOM coin is ranked at #28 as per the market cap ranking. The coin fell by 19% in a month.
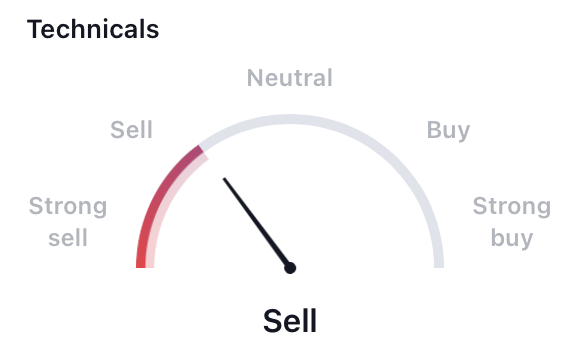
As per the technical summary tool, Cosmos coin is indicating a sign of bearish momentum. Out of the total 26 indicators, the majority are indicating a bearish move. This shows that the price is in a negative direction.
Cosmos (ATOM) Technical Analysis
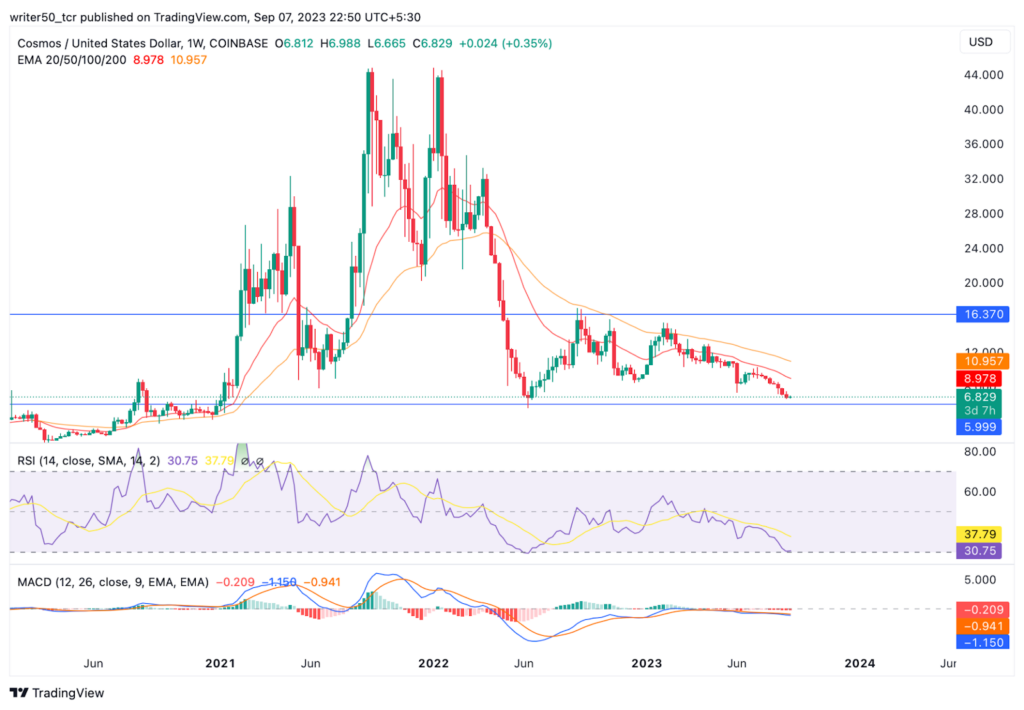
The 50 and 100-day EMA levels are trading above the Cosmos coin price. This is a positive sign for the coin. The price is likely to rise in the future.
For ATOM, the signal line is at -0.6 and the MACD line is now trading at -0.9. This demonstrates that the MACD line for Cosmos coin is below the signal line. This is a negative indicator for the coin. As a result, the price of the ATOM coin will probably fall.
Cosmos’ RSI line is currently moving towards the negative region. The RSI line is below the SMA line. This is a negative signal for the ATOM coin. The probability for the price to decline is higher.
Conclusion
As per the analysis, the price of Cosmos (ATOM) coin price is moving in a downward direction. The volume of the coin is also declined, as per the data. The indicators like RSI, MACD, and EMA are also giving negative signals. The overall structure of the coin is negative and the price may fall in the upcoming days.
Technical Levels
- Support Level: $6.8
- Resistance Level: $16.3
Disclaimer
The views and opinions of the author, or anyone named in this article, are for informational purposes only. They do not offer financial, investment, or other advice. Investing or trading crypto assets involves the risk of financial loss.




