
 Quack AI
 Quant
Quant Pudgy Penguins
 Ondo
Ondo NEAR Protocol
 Starknet
 Bittensor
- The stock has seen some correction after making its all-time high in April 2023.
- The bears are active at the immediate resistance level and are pushing the price down.
- The MACD and RSI have seen some short-term bearish crossover as the FTSE 100 index falls.
The stock of Burberry Group Plc (LON: BRBY) has been on a long uptrend since it reached the level of £2447 in February of this year. It seems like that level acted as a strong resistance zone, where the bears were active and maintained control. However, the bulls showed a bullish rally as the BRBY stock price rose to its all-time high levels in April 2023, breaking past the resistance level of £2512.
Technical Analysis and Price Prediction
At the time of writing, the BRBY stock price has bounced off its immediate support level of £2015 and is attempting to overcome its immediate resistance of £2262. The bulls have attempted several times to break through, but the bears have reclaimed this resistance level several times since July this year. However, beyond the immediate supports and resistances, there are two more supports and resistances at the levels of £1827 and £2383, respectively.
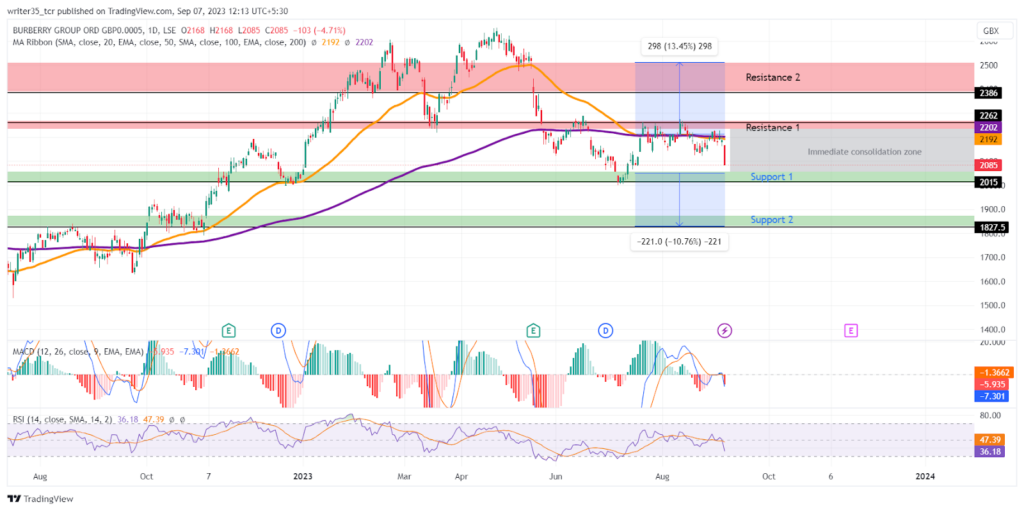
Between the supports and resistances, the MACD indicator is showing a sudden downfall. Its exponential moving average (EMA) line is at -1.53, while the MACD line has suddenly dropped to -7.30. This sudden drop in bullish strength may be due to the drop in the FTSE 100, as the BRBY stock price is one of its constituents.
RSI and EMA levels
Meanwhile, the relative strength index (RSI) line is also showing something similar as the bulls are struggling to break through the resistance level. The RSI line has been constantly in its neutral territory near 50, but it has dropped to 36 due to the day’s price fall as we saw above. Additionally, its Simple Moving Average (SMA) is at the level of 47.
Currently, the EMAs of the price values are near their immediate resistance. During the bullish rally at the end of 2022, the 50 EMA showed a bullish crossover with the 200 EMA. At present, the 50 EMA is at £2192 which is slightly lower than the 200 EMA at £2202. This has made it difficult for the bulls to surpass the £2262 level.
Conclusion:
Overall, these technical indicators suggest a bearish trend for BRBY stock as the price has fallen below the very small support level of £2165. BRBY stock price is likely to move toward its immediate support level of £2015. One of the things to notice here is the strength of this immediate support, which has been tested quite a few times before. If the bulls reclaim this support level again, then it is likely that they will break past the EMA resistance.
However, traders will need to keep a close eye on the support and resistance levels of the FTSE index to determine BRBY stock’s future direction. Any significant break above or below these levels of FTSE 100 could indicate a change in the BRBY stock price.
Technical Levels
Support:£2015, £1827
Resistance: £2262, £2386
Disclaimer
The views and opinions stated by the author, or any people named in this article, are for informational purposes only. They do not establish financial, investment, or other advice. Investing in or trading crypto assets comes with a risk of financial loss.




