
 Boomer
 hi
hi Covenant x402
 NEAR Protocol
 Injective
 Quantus
 Solana
- Southern Company’s price has an average volume of $9.9 Million.
- Southern Company stock has a dividend yield of 2.82%.
Southern Company Inc. (SO) stock is trading in a downward momentum. The price of SO is forming a lower-low pattern. The price of SO stock is creating a strong bearish pattern.
Financial Data of Southern Company Inc. (NYSE: SO)
The Southern Company Inc. has a market capitalization of $73.13 Billion. The stock is trading at $67.11 as of 8 September 2023. The revenue of the SO is $29.2 Billion and the beta of the stock is 0.67.
The gross profit for Q2 2023 for the SO stock is $1.62 Billion, with a decline of 22.3% year-over-year (YoY). The Return on Assets of the SO has also decreased by 2.7% YoY.
The Southern Company (SO) stock has shown a return of -14.4% in one year. The price of the SO stock is forming a negative structure. The price is currently trading in between the channel pattern and there is a high probability for the price to break the support level.
According to the Income statement, Southern Company Inc.’s quarterly profit margin % is decreasing and the revenue is also decreasing. This is a negative sign for the stock and the overall income statement is showing a poor result.
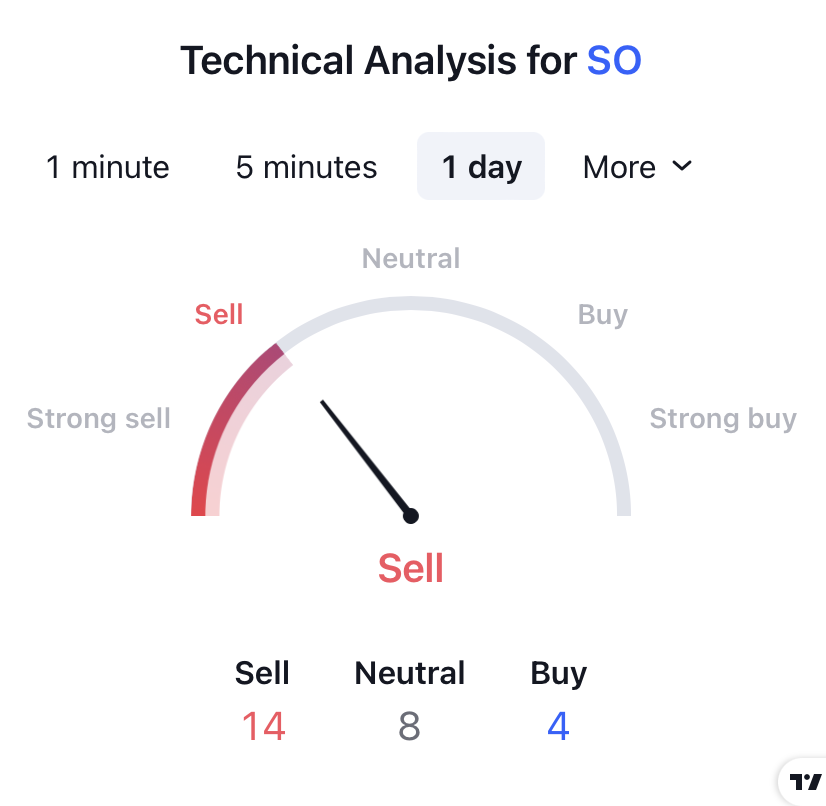
The Southern Company Inc. (NYSE: SO) stock is showing bearish momentum according to the technical summary. Out of 26 indicators, 14 are bearish on stock and only 4 are bullish.
Southern Company Inc. (SO) Technical Analysis
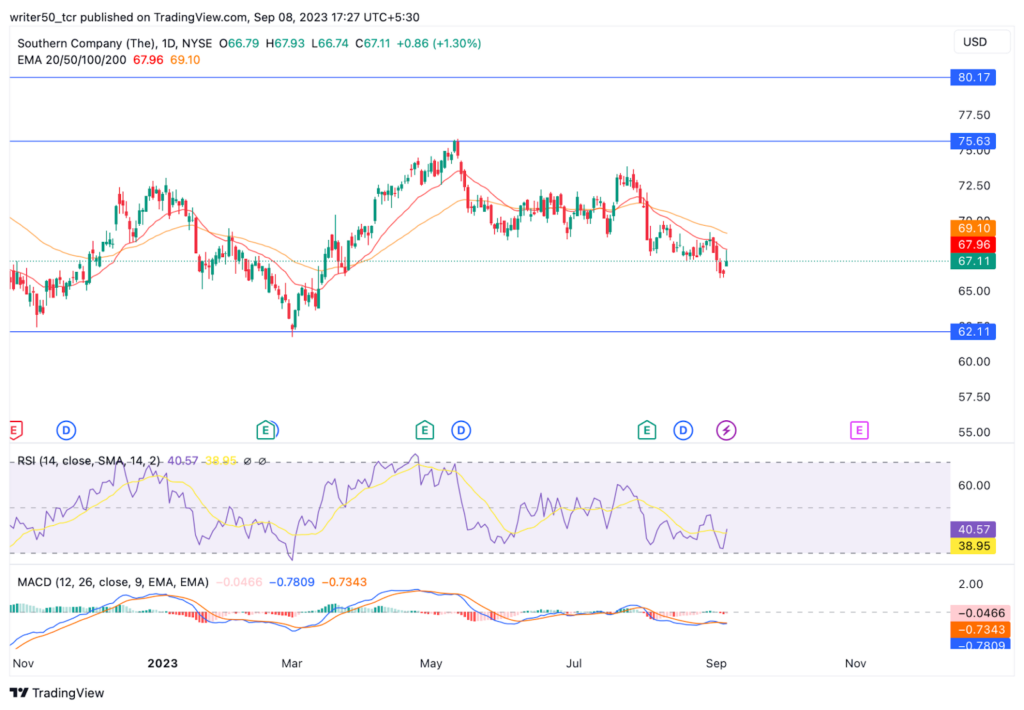
The 50-day and 100-day EMA for the Southern Company stock is trading above the stock price. This is a negative signal for the stock. The chances for the price to decline are higher.
The MACD line for the SO stock is currently at -0.6 and the signal line is at -0.9. This shows that the MACD line is below the signal line. This is a weak signal and the price is likely to decline.
The RSI line of the Southern Company stock is trading below the SMA line. The RSI is showing a negative momentum and a further decline in the price is expected.
Conclusion
In conclusion, Southern Company Inc. (SO) stock is weak on charts. The price has given negative returns in the past few years. The volume of the stock has also declined by a huge percentage. The overall structure of the stock is negative. Hence, a further price fall is expected in the upcoming days.
Technical Levels:
- Support Level: $57
- Resistance Level: $66
Disclaimer
The views and opinions of the author, or anyone named in this article, are for informational purposes only. They do not offer financial, investment, or other advice. Investing or trading crypto assets involves the risk of financial loss.




