
 hi
hi Boomer
 Lighter
 NEAR Protocol
 Covenant x402
 Pudgy Penguins
 Injective
- Berkshire Hathaway price rose by 30.55% in a year.
- Berkshire Hathaway stock has a basic EPS of $39.82.
- BRK.B has an average volume of $2.4 Million.
Berkshire Hathaway Inc. is a conglomerate that holds ownership in multiple subsidiaries involved in diverse business endeavors. These activities encompass insurance operations conducted in both primary and reinsurance capacities.
Berkshire Hathaway Inc. (BRK.B) stock is trading in an upward momentum. The price of BRK.B is forming a lower-low pattern. The price of BRK.B stock is creating a strong bullish pattern.
Financials of Berkshire Hathaway Inc. (NYSE: BRK.B)
The Return on capital invested in the BRK.B has also decreased by 16.2% YoY.
Over the past six months, Berkshire Hathaway (BRK.B) stock has exhibited a commendable return of 20%. The stock’s price chart suggests a positive structural pattern, with current trading occurring within a channel pattern. There are promising indications of a potential breakout above the resistance level.
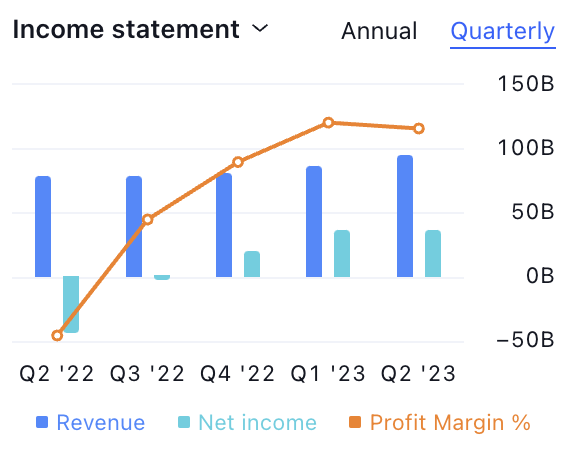
According to the income statement, Berkshire Hathaway Inc.’s quarterly profit margin % is increasing and the revenue is also increasing. This is a positive sign for the stock and the overall income statement is showing a positive result.
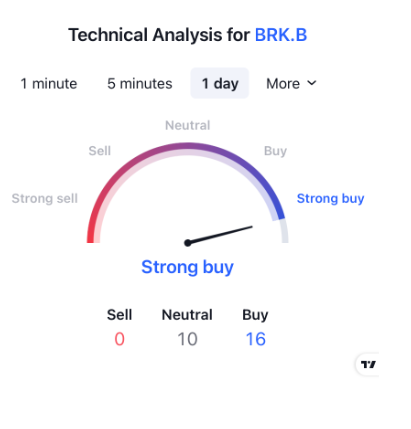
As per the technical summary, the Berkshire Hathaway Inc. is showing a positive momentum. Out of 26 indicators, 16 are bullish on the stock and 0 indicators are bearish. This shows that the BRK.B stock is extremely positive.
Berkshire Hathaway Inc. (BRK.B) Technical Analysis
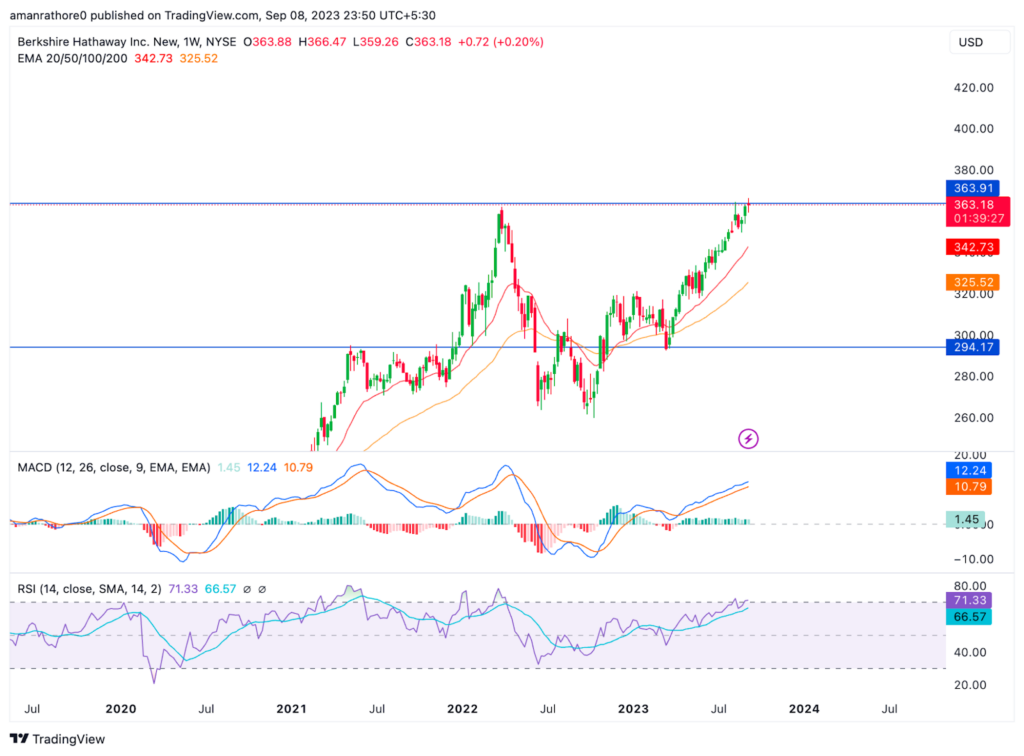
The 50-day and 100-day Exponential Moving Averages (EMA) for Berkshire Hathaway stock are both positioned above the stock’s current price. This is positive indication, suggesting an increased likelihood of price appreciation.
Looking at the Moving Average Convergence Divergence (MACD) indicator, the MACD line for BRK.B currently at 12, while the signal line stands at 10. This configuration illustrates that the MACD line is above the signal line which typically signifies a positive signal and anticipates a potential price upswing.
Additionally, the relative strength index (RSI) for Berkshire Hathaway stock exhibits an interesting pattern. The RSI line is trading below the simple moving average (SMA) line indicating a positive momentum.
Conclusion
In conclusion, the BRK.B stock is moving in an uptrend. The stock rose by 30.55%. The indicators are giving a positive signal. Hence, the price is likely to rise in the upcoming days.
Technical Levels:
- Support Level: $294
- Resistance Level: $363
Disclaimer
The views and opinions of the author, or anyone named in this article, are for informational purposes only. They do not offer financial, investment, or other advice. Investing or trading crypto assets involves the risk of financial loss.




