
 Pearl
Pearl Bitcoin
 NEAR Protocol
 Starknet
 Solana
 Quant
Quant Ondo
Ondo
- Fuel terminal disruptions are affecting the stock of KMI stock negatively.
- Kinder Morgan has a total of 10.525K employees.
KMI was founded in 1997 and works in oil and gas pipelines industry. The company pays good amount of dividend to its investors and has paid a total of $1.10 as a dividend in the year 2022 and the dividend yield by the company is 6.10% following a payout of 98.20%.
The average trading volume of the share is 12.66M following a beta of 0.94 which means that the share price is less volatile and moves lesser as compared to the market as a whole.
The market cap of the company has advanced by 1.6% year-on-year and the net cash at company has also advanced by +24.7%. As per Q2 2023 the company’s account receivables has declined by 37.8% year-on-year and the current value of the receivables is $1.28B following an advance of 0.3% in long-term debt.
Kinder Morgan Inc. Performance Analysis
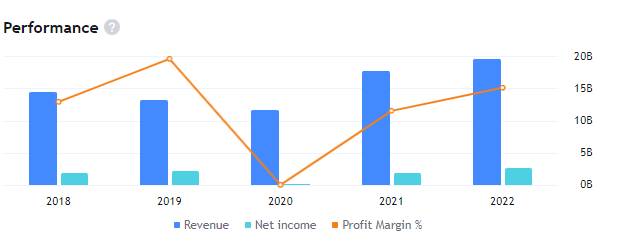
KMI has shown an advance in revenue from the year 2021-2022. The revenue for the company in the year 2021 was $17.53B which advanced to $19.55B in the year 2022. Gross margin of the company has advanced by 28.1% year-on-year as compared to Q2 2023 following a decline of 19.2% in gross profit.
The financial data of the company shows mixed sentiments for the share.
KMI Technologies Technical Analysis
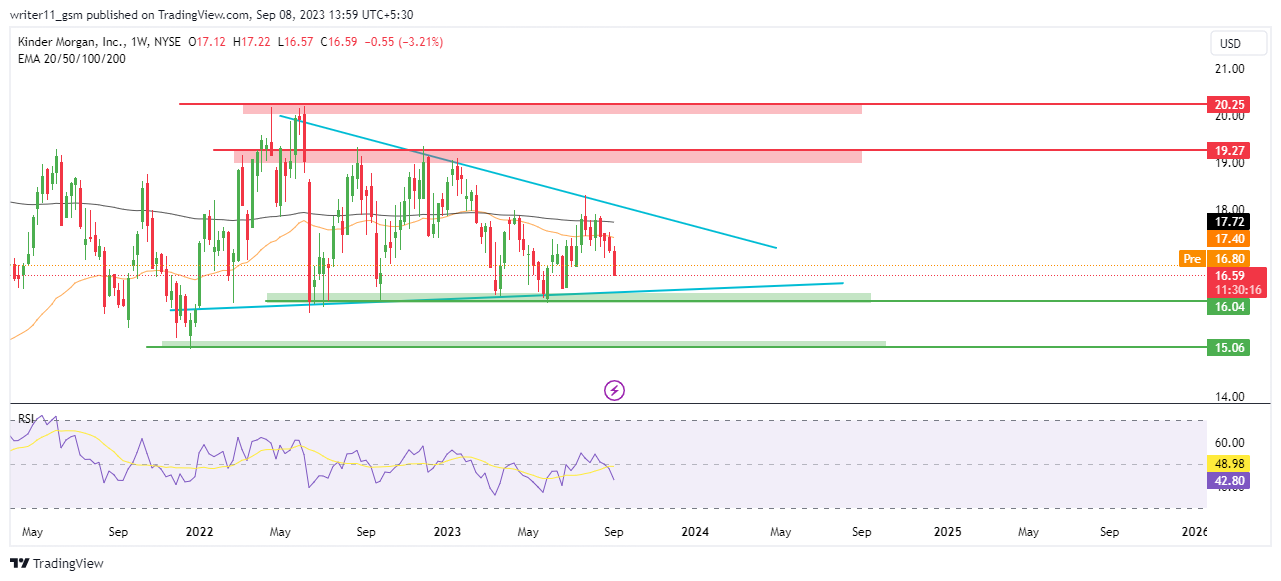
The share price of KMI has been consistently declining from higher levels creating lower lows and leading to the formation of a descending triangle pattern and can decline further to the lower levels if it breaks below the triangle pattern.
Due to consistent decline in price the 50-day and the 200-day Exponential Moving Average has led to a death cross on charts which means that the stock is in a downtrend and may can decline to lower levels. This also means that the price can advance further in the upcoming days.
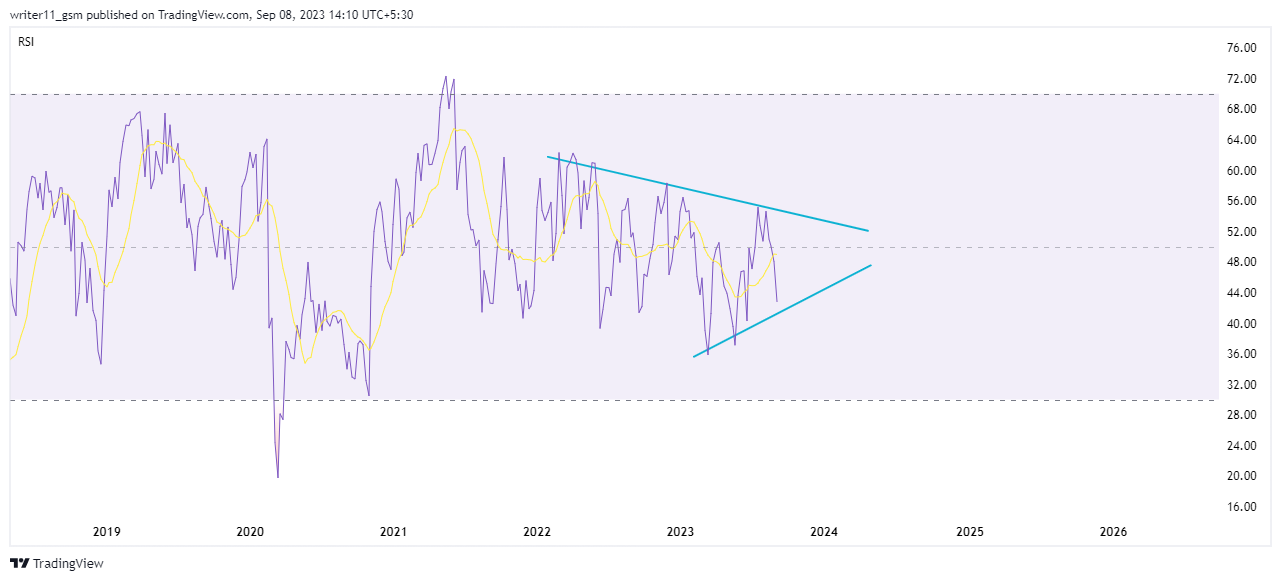
The RSI for the KMI share is trading inside a range as the price has been trading in a smaller range following a descending triangle pattern, therefore the RSI is uncertain unless it breaks above or below the pattern on charts.
Technical Overview of KMI Stock
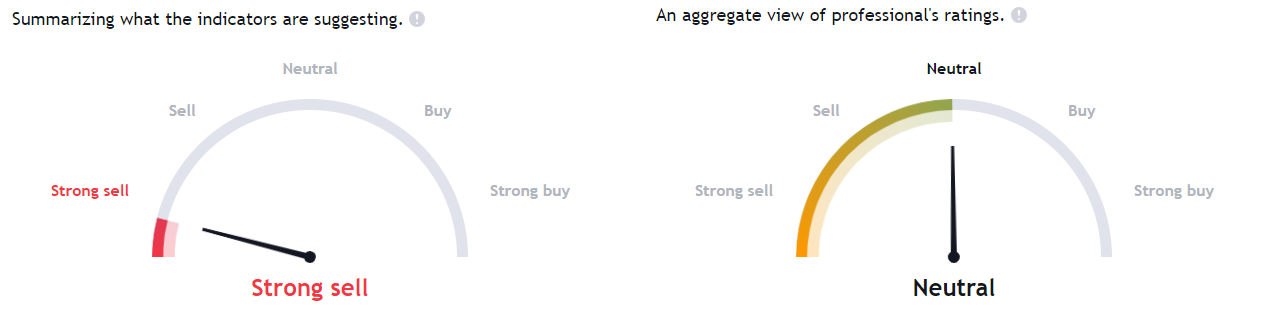
Based upon the analysis and technical summary widget the stock price seems uncertain at the current moment as the technical are highly bearish but the analysts are neutral on the stock.
Conclusion
The price of the KMI share is currently trading inside a descending triangle pattern and the EMA and the RSI are also behaving uncertain to bearish therefore, any decline in price below the triangle pattern can lead to a very good momentum on the downside.
Technical Levels
- The support levels for KMI Stock are – $15.00 and $16.00
- The resistance levels for KMI stock are – $19.50 and $20.25
Disclaimer
The information provided in this article, including the views and opinions expressed by the author or any individuals mentioned, is intended for informational purposes only. It is important to note that the article does not provide financial or investment advice. Investing or trading in cryptocurrency assets carries inherent risks and can result in financial loss.




