
 Pearl
Pearl Ondo
Ondo Ethereum
 Bitway
 Derive
 Pudgy Penguins
 NEAR Protocol
- The price of the DOT coin has been consistently declining since its ICO.
- Polkadot is based on the Layer 1 category of coins.
The derivatives volume of the DOT coin has advanced by 183.08% in the last 24 hours, resulting in $179.78 Million and the open interest has also advanced by +5.73%. The long/short ratio of the crypto is 0.9402. The coin also showed a huge liquidation of $539.65K in the last 24 hours.
The spot trading volume of the crypto has also increased by +71.60 in the last 24 hours, resulting in a market cap of $5.04 Billion, which has declined by 2.63%, which represents a price decline. The coin has an infinite maximum supply and the circulating supply of the coin is 1.22 Billion DOT.
As per CoinMarketCap, the market cap ranking of the Polkadot crypto is 13th and the volume/market cap ratio of the coin is 0.0207, following a market cap dominance of 0.488%. The crypto’s maximum volume is traded on the USDT pair, representing 63.43% of the total crypto volume.
Polkadot Price Technical Analysis
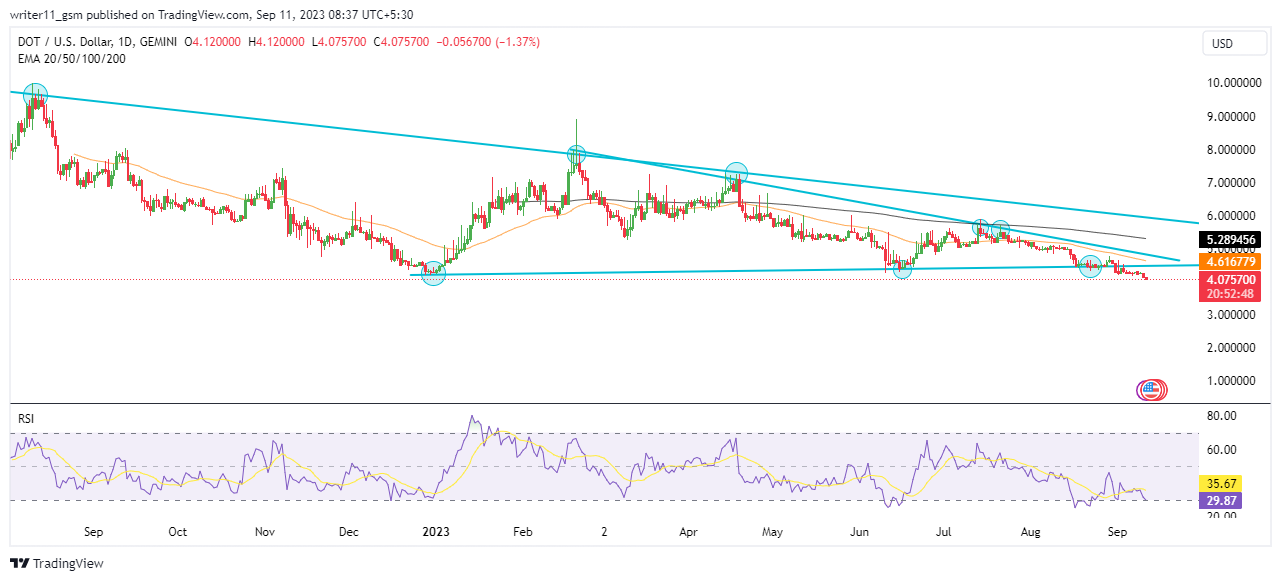
The Polkadot price has been consistently declining after making an all-time high of $54.98, leading to the consistent formation of lower lows and lower highs, which led to the formation of a descending triangle pattern in the larger and smaller timeframes. The market has also broken down below the same pattern, which indicates further bearishness to be followed by crypto in the upcoming days.
The consistent decline in the price of the crypto denotes the presence of sellers in the market, which indicates a price decline. Due to this consistent decline in price, the market is following a death cross of the 50-day and the 200-day EMAs, which indicates the price to be weak and in a consistent downtrend.
The RSI of the crypto seems very bearish as it has been unable to hit the overbought level of 70 for a very, very long time and has been consistently sustaining below the 50-level which indicates the price is in a downtrend.
Polkadot Volume Analysis
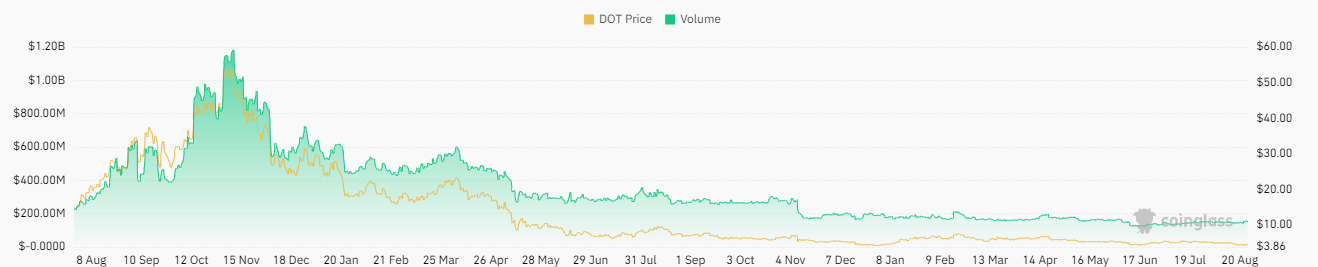
The derivative data for the DOT crypto has been constant and dry for a very long time and has recently shown a spike of 183.08% in the last 24 hours, which is still too little as compared to the volume of November 2021, which reached $1.17 Billion.
Conclusion
The DOT crypto broke down below the descending triangle pattern with an advance in volume and has been consistently declining from higher levels, making lower lows following a death cross EMA band and a negative RSI. This indicates the presence of sellers and negative sentiment in crypto.
Therefore, the price of the crypto may continue to decline unless the market changes its character and breaks above the swing high of $7.2, as breaking the following level will lead to a bullish change of character in the market.
Technical Levels
- Support Level: $3.500 and $4.00
- Resistance Level: $7.10 and $9.60
Disclaimer
The views and opinions stated by the author or any other person named in this article are for informational purposes only and do not constitute financial, investment, or other advice. Investing in or trading crypto or stocks comes with a risk of financial loss.




