
 Dacity Coin
 Celestia
 Pudgy Penguins
 Injective
 Solana
 Sui
Sui Starknet
- Walgreens Boots Alliance, Inc.’s (WBA) stock price has broken down into a descending triangle pattern.
- WaBA, Inc.’s stock price has decline more than 41% YTD.
Walgreens Boots Alliance, Inc. provides healthcare and retail pharmacy services. WBA was founded in 1901 in Deerfield, IL.
Walgreens Boots Alliance, Inc. (NASDAQ: WBA) stock is currently moving in an uptrend. The WBA stock price is forming a pattern of higher highs after recently making an all-time high.

Walgreens Boots Alliance, Inc.’s stock has a current market price of $21.80. The stock price declined by 0.86% on September 11, 2023. The stock has shown a 30% decline in its market cap in Q2 2023. The return on capital investment for WBA stock for the second quarter of 2023 is 7.1%, and the figure declined by 7.1% YoY.
A dividend payout ratio of -50.03% couple with a dividend yield of 8.73% raises a red flag. A negative payout ratio means that the company is distributing more in dividends than it is earning, which is unsustainable in the long run and can signal financial troubles.
WBA stock hit a high of $97.30 in July 2015. Since then, the stock has been in a downtrend. The stock has decline by almost 78% until today. WBA stock has recently broken out of the descending triangle pattern. This is a bearish pattern, and the price forms a negative pattern. This breakout confirms that the price might continue to fall further, causing the bears to step into action.
Talking about the headlines, Walgreen Boots Alliance, Inc. CEO Rosalind Brewer has resigned from her post. This is a piece of negative news for the stock price, which can be one factor behind the stock price decline.
Walgreens Boots Alliance, Inc.’s stock has declined almost 39% in one year. A further decline is expected as the overall structure is poor.
Walgreens Boots Alliance Inc. (WBA) Stock Price Analysis
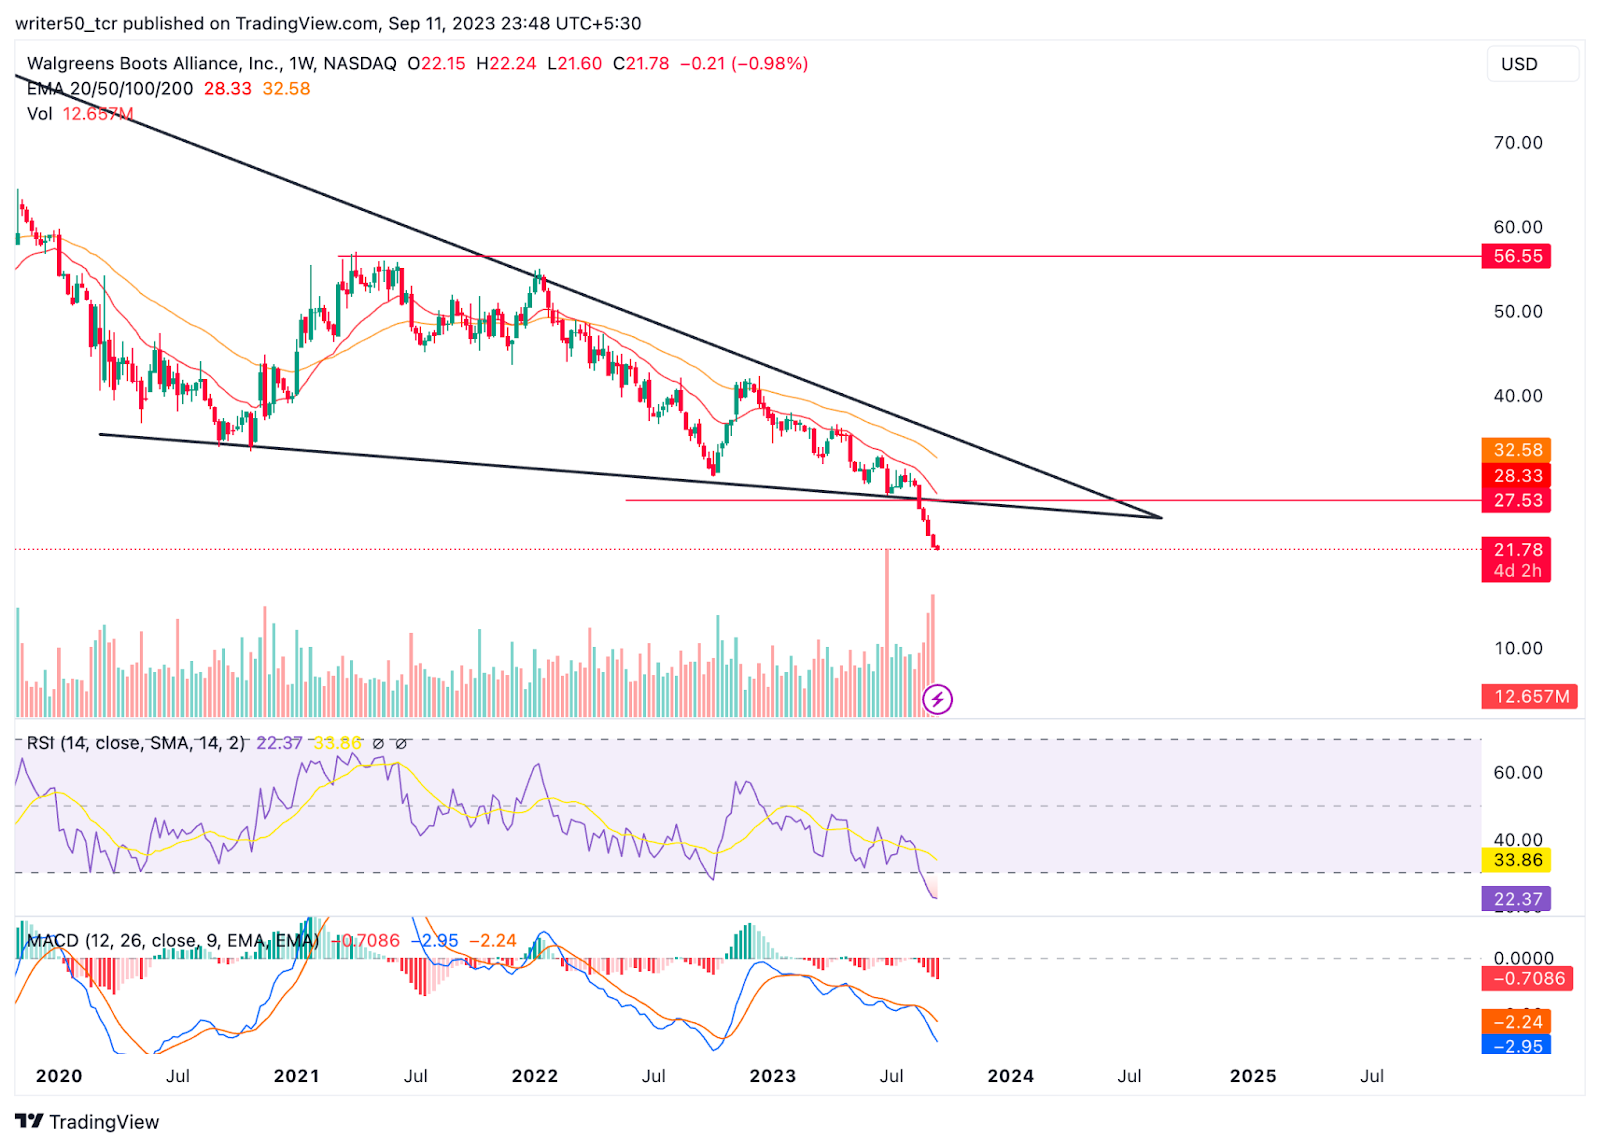
Technical Indicators Overview
The WBA stock price is trading below the 50-day and 100-day EMAs, and the bearish crossover among the EMAs is identifiable. This is a bearish signal.
The RSI line has hit the oversold zone and is currently sustaining in the same zone. This confirms that the stock is negative.
Conclusion
In conclusion, WBA stock is moving in a downtrend. The price has recently given a breakout from the descending triangle pattern and made a fresh all-time low. The stock price decline by almost 33.7% in the last six months.
Technical Levels
Support Level: $15, $12
Resistance Level: $27.52
Disclaimer
The views and opinions of the author, or anyone named in this article, are for informational purposes only. They do not offer financial, investment, or other advice. Investing in or trading crypto assets involves the risk of financial loss.




